|
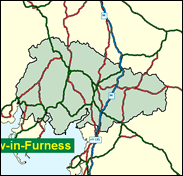
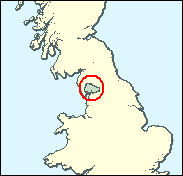
Westmorland & Lonsdale
Conservative hold

The southern Lakes saw a larger than average drop in Conservative support in 1997, and both the Liberal Democrats and Labour advanced; if there had been more tactical voting, presumably in favour of the Lib Dems, the seat would have looked marginal for the first time in living memory. It is hard to imagine that this result was not generated to some extent by the retirement after 33 years of the popular bluff figure of an old-fashioned Tory, Sir Michael Jopling, Mrs Thatcher's Agriculture Secretary for some years, and his replacement by a young unmarried apparatchik from Central Office with allegations of central imposition by a frustrated would be and more local candidate, Peter Thurnham, MP for Bolton NE, who promptly defected to the Liberal Democrats. This is indeed a bucolic seat, celebrated by poets such as Wordsworth and Coleridge, and the mecca for visitors from all over the world to see scenery recognised very early on as romantic and attractive. The tourist industry has temporarily been hard hid by the foot and mouth epidemic, at its very worst in the county of Cumbria. Tim Collins may well do better next time, unless the Liberal Democrats, who are the largest party on South Lakeland council, can continue their advance and squeeze the Labour vote, which is confined largely to the largest town, Kendal.

Tom Collins, a Tory Vice Chairman, is living proof of the existence of the "professional politician", the man who has never done anything else in his working life. Born 1964, son of a Tory-voting farmer and local Tory Association Chairman mother, he attended Chigwell School and King's College London, and went, at 22, straight into Central Office, advised Michael Howard (against the minimum wage), was Major's press secretary during the 1992 election, ran the Party's PR for three years and served in the No. 10 Policy Unit. With slight hints of an estuarial accent, with the obsessive politico's beady-eyed partisan glint and an allegedly restricted cultural hinterland, he has been described as "Harry Enfield playing a computer nerd".
 |
| Wealthy Achievers, Suburban Areas |
9.85% |
14.99% |
65.70 |
|
| Affluent Greys, Rural Communities |
27.16% |
2.13% |
1,277.54 |
|
| Prosperous Pensioners, Retirement Areas |
8.26% |
2.49% |
332.33 |
|
| Affluent Executives, Family Areas |
0.00% |
4.43% |
0.00 |
|
| Well-Off Workers, Family Areas |
5.53% |
7.27% |
76.06 |
|
| Affluent Urbanites, Town & City Areas |
0.00% |
2.56% |
0.00 |
|
| Prosperous Professionals, Metropolitan Areas |
0.00% |
2.04% |
0.00 |
|
| Better-Off Executives, Inner City Areas |
1.43% |
3.94% |
36.19 |
|
| Comfortable Middle Agers, Mature Home Owning Areas |
16.47% |
13.04% |
126.30 |
|
| Skilled Workers, Home Owning Areas |
7.86% |
12.70% |
61.90 |
|
| New Home Owners, Mature Communities |
12.75% |
8.14% |
156.63 |
|
| White Collar Workers, Better-Off Multi Ethnic Areas |
5.23% |
4.02% |
129.97 |
|
| Older People, Less Prosperous Areas |
2.20% |
3.19% |
69.15 |
|
| Council Estate Residents, Better-Off Homes |
3.17% |
11.31% |
28.05 |
|
| Council Estate Residents, High Unemployment |
0.03% |
3.06% |
1.04 |
|
| Council Estate Residents, Greatest Hardship |
0.00% |
2.52% |
0.00 |
|
| People in Multi-Ethnic, Low-Income Areas |
0.00% |
2.10% |
0.00 |
|
| Unclassified |
0.04% |
0.06% |
71.26 |
|
|
 |
|
|
| £0-5K |
8.20% |
9.41% |
87.09 |
|
| £5-10K |
16.53% |
16.63% |
99.36 |
|
| £10-15K |
17.55% |
16.58% |
105.89 |
|
| £15-20K |
14.72% |
13.58% |
108.37 |
|
| £20-25K |
11.24% |
10.39% |
108.19 |
|
| £25-30K |
8.27% |
7.77% |
106.36 |
|
| £30-35K |
6.00% |
5.79% |
103.57 |
|
| £35-40K |
4.34% |
4.33% |
100.26 |
|
| £40-45K |
3.16% |
3.27% |
96.71 |
|
| £45-50K |
2.31% |
2.48% |
93.10 |
|
| £50-55K |
1.71% |
1.90% |
89.53 |
|
| £55-60K |
1.27% |
1.47% |
86.07 |
|
| £60-65K |
0.95% |
1.15% |
82.75 |
|
| £65-70K |
0.72% |
0.91% |
79.60 |
|
| £70-75K |
0.55% |
0.72% |
76.62 |
|
| £75-80K |
0.42% |
0.57% |
73.80 |
|
| £80-85K |
0.33% |
0.46% |
71.15 |
|
| £85-90K |
0.26% |
0.37% |
68.66 |
|
| £90-95K |
0.20% |
0.31% |
66.32 |
|
| £95-100K |
0.16% |
0.25% |
64.11 |
|
| £100K + |
0.71% |
1.34% |
52.93 |
|
|
|
|


|
1992-1997
|
1997-2001
|
|
|
|
| Con |
-14.64% |
| Lab |
5.48% |
| LD |
5.86% |
|
| Con |
31.46% |
| Lab |
-3.43% |
| LD |
-27.00% |
|
|
|
Tim Collins
Conservative hold
|
| Con |
 |
22,486 |
73.72% |
| Lab |
 |
5,234 |
17.16% |
| LD |
 |
1,939 |
6.36% |
| Oth |
 |
844 |
2.77% |
| Maj |
 |
17,252 |
56.56% |
| Turn |
|
30,503 |
43.18% |
|
|
|
Tim Collins
Conservative hold
|
| L |
John Bateson |
5,234 |
17.16% |
| I |
Tim Bell |
292 |
0.96% |
| C |
Tim Collins |
22,486 |
73.72% |
| LD |
Tim Farron |
1,939 |
6.36% |
| UK |
Robert Gibson |
552 |
1.81% |
|
Candidates representing 5 parties stood for election to this seat.
|
|
|
Tim Collins
Conservative
|
| Con |
|
21,470 |
42.26% |
| Lab |
|
10,459 |
20.58% |
| LD |
|
16,949 |
33.36% |
| Ref |
 |
1,931 |
3.80% |
| Oth |
|
0 |
0.00% |
| Maj |
|
4,521 |
8.90% |
| Turn |
|
50,809 |
74.29% |
|
|
|
|
Conservative
|
| Con |
|
29,775 |
56.90% |
| Lab |
|
7,898 |
15.10% |
| LD |
|
14,381 |
27.50% |
| Oth |
|
273 |
0.50% |
| Maj |
|
15,394 |
29.40% |
| Turn |
|
52,327 |
77.50% |
|
|
|
|
|