|
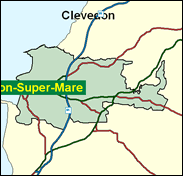
Weston-Super-Mare
Liberal Democrat hold

The Liberal Democrats swept away many Tory seats in the South West of England in 1997. One of the less likely was Weston super Mare, and this may well prove a one-off, especially given the failure of the party to repeat that success in European or North Somerset unitary authority elections, both in 1999. The Conservatives polled 37 pc in the 13 wards which make up the seat then to The Lib Dems' 26 pc, an ominous sign as the latter almost always do better in local contests than in general elections, and the second worst showing in any LD held marginal against Tory challengers. Labour's vote does not look like being squeezed - they have nine councillors in Weston itself and 24 pc of the vote there in 1999 - and it would be a major surprise if John Penrose did not win this seat at least back for the Conservatives next time.

Brian Cotter, a small plastics manufacturer born 1938 and educated at Benedictine public schools (including Downside), won the seat in 1997. An oval-faced, beaky, de Gaulle-without-the-height look-alike, with thinning hair draped across a balding pate, he has hit few headlines as his party's spokesman on - inevitably as owner of one - small businesses, and as an internet buff. The Conservative's candidate, John Penrose, born 1964, the son of schoolteachers, is in academic publishing, though originally was a merchant banker with J P Morgan and a management consultant with McKinsey's. Educated at Ipswich School, Downing College, Cambridge and Columbia University, New York (where he obtained an MBA), he has produced Bow Group papers on constituency reform, party modernisation, reforming Europe, and women MPs. Though London-based, his wife is from a West Country farming family, steeplechases, hunts, and is a keen supporter of the Countryside Alliance.
 |
| Wealthy Achievers, Suburban Areas |
21.24% |
14.99% |
141.68 |
|
| Affluent Greys, Rural Communities |
0.41% |
2.13% |
19.34 |
|
| Prosperous Pensioners, Retirement Areas |
10.30% |
2.49% |
414.14 |
|
| Affluent Executives, Family Areas |
7.16% |
4.43% |
161.85 |
|
| Well-Off Workers, Family Areas |
3.61% |
7.27% |
49.58 |
|
| Affluent Urbanites, Town & City Areas |
0.05% |
2.56% |
1.91 |
|
| Prosperous Professionals, Metropolitan Areas |
0.00% |
2.04% |
0.00 |
|
| Better-Off Executives, Inner City Areas |
9.33% |
3.94% |
236.61 |
|
| Comfortable Middle Agers, Mature Home Owning Areas |
20.13% |
13.04% |
154.37 |
|
| Skilled Workers, Home Owning Areas |
2.76% |
12.70% |
21.76 |
|
| New Home Owners, Mature Communities |
11.16% |
8.14% |
137.08 |
|
| White Collar Workers, Better-Off Multi Ethnic Areas |
2.24% |
4.02% |
55.66 |
|
| Older People, Less Prosperous Areas |
1.90% |
3.19% |
59.69 |
|
| Council Estate Residents, Better-Off Homes |
6.52% |
11.31% |
57.65 |
|
| Council Estate Residents, High Unemployment |
1.03% |
3.06% |
33.67 |
|
| Council Estate Residents, Greatest Hardship |
2.15% |
2.52% |
85.40 |
|
| People in Multi-Ethnic, Low-Income Areas |
0.00% |
2.10% |
0.00 |
|
| Unclassified |
0.00% |
0.06% |
6.53 |
|
|
 |
 |
 |
| £0-5K |
9.57% |
9.41% |
101.64 |
|
| £5-10K |
17.11% |
16.63% |
102.90 |
|
| £10-15K |
17.17% |
16.58% |
103.54 |
|
| £15-20K |
14.05% |
13.58% |
103.47 |
|
| £20-25K |
10.67% |
10.39% |
102.68 |
|
| £25-30K |
7.88% |
7.77% |
101.30 |
|
| £30-35K |
5.76% |
5.79% |
99.51 |
|
| £35-40K |
4.22% |
4.33% |
97.46 |
|
| £40-45K |
3.11% |
3.27% |
95.27 |
|
| £45-50K |
2.31% |
2.48% |
93.03 |
|
| £50-55K |
1.73% |
1.90% |
90.79 |
|
| £55-60K |
1.31% |
1.47% |
88.60 |
|
| £60-65K |
1.00% |
1.15% |
86.48 |
|
| £65-70K |
0.77% |
0.91% |
84.45 |
|
| £70-75K |
0.59% |
0.72% |
82.51 |
|
| £75-80K |
0.46% |
0.57% |
80.66 |
|
| £80-85K |
0.36% |
0.46% |
78.90 |
|
| £85-90K |
0.29% |
0.37% |
77.23 |
|
| £90-95K |
0.23% |
0.31% |
75.65 |
|
| £95-100K |
0.19% |
0.25% |
74.14 |
|
| £100K + |
0.89% |
1.34% |
66.04 |
|
|
|

|


|
1992-1997
|
1997-2001
|
|
|
|
| Con |
-10.38% |
| Lab |
6.50% |
| LD |
1.61% |
|
| Con |
1.03% |
| Lab |
1.88% |
| LD |
-0.64% |
|
|
 |
Brian Cotter
Liberal Democrat hold
|
| Con |
 |
18,086 |
38.74% |
| Lab |
 |
9,235 |
19.78% |
| LD |
 |
18,424 |
39.47% |
| Oth |
 |
935 |
2.00% |
| Maj |
 |
338 |
0.72% |
| Turn |
 |
46,680 |
62.79% |
|
|
 |
Brian Cotter
Liberal Democrat hold
|
| LD |
Brian Cotter |
18,424 |
39.47% |
| L |
Derek Kraft |
9,235 |
19.78% |
| UK |
Bill Lukin |
650 |
1.39% |
| C |
John Penrose |
18,086 |
38.74% |
| Ind Pev |
John Peverelle |
206 |
0.44% |
| Ind Sib |
Richard Sibley |
79 |
0.17% |
|
Candidates representing 6 parties stood for election to this seat.
|
|
 |
Brian Cotter
Liberal Democrat gain
|
| Con |
 |
20,133 |
37.72% |
| Lab |
 |
9,557 |
17.90% |
| LD |
 |
21,407 |
40.11% |
| Ref |
 |
2,280 |
4.27% |
| Oth |
|
0 |
0.00% |
| Maj |
 |
1,274 |
2.39% |
| Turn |
 |
53,377 |
73.68% |
|
|
 |
|
Conservative
|
| Con |
 |
27,063 |
48.10% |
| Lab |
 |
6,420 |
11.40% |
| LD |
 |
21,691 |
38.50% |
| Oth |
 |
1,131 |
2.00% |
| Maj |
 |
5,372 |
9.50% |
| Turn |
 |
56,305 |
79.47% |
|
|
 |
|

|

