|
Bishop Auckland
Labour hold

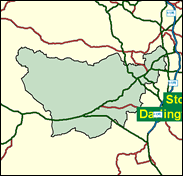
County Durham is usually regarded as a citadel of heavy industry and embedded Labour strength, and in the main this is an accurate description, but the seat of Bishop Auckland covering the south west of the county also has much rural territory, with farmland in the valleys between the high moors of the northern pennines. in upper Teesdale, around Barnard Castle, are even to be found a few Tory councillors in this most Labour of counties. However, this area, though physically large, has been won continuously by Labour since 1935, as the eastern end, dominated by the traditions of coal mining and other heavy industry, around Spennymoor and Shildon for example, have tipped the balance decisively. In 1997 the Liberal Democrats, sporadically active in local government, especially in Wear Valley, found their share of the vote halved, which was proportionately an even worse fate than befell the Tories.

Once an orthodox authority figure as Labour's Chief Whip, Derek Foster, MP since 1979, has joined the ranks of the disaffected, having resigned after two days as a minister in 1997, on realising he was not getting the Cabinet post promised in return for standing down as the elected Chief Whip to enable Tony Blair to appoint future occupants. Born 1937 and educated at Bede Grammar School, Sunderland and St Catherine's College, Oxford, he has been described as ‘a Salvationist who does not blow his own trumpet', yet he certainly blasted the Blair government in 1999 as ‘not fit to polish the boots of the post-war Attlee government'. This showed how relations between Durham-based Labour leaders in the ‘nineties (Blair, Foster, Mandelson, Clark), were as acrimonious as in the ‘forties between Dalton, Shinwell, Chuter Ede and Whiteley.

 |
| Wealthy Achievers, Suburban Areas |
5.06% |
14.99% |
33.75 |
|
| Affluent Greys, Rural Communities |
4.90% |
2.13% |
230.54 |
|
| Prosperous Pensioners, Retirement Areas |
0.01% |
2.49% |
0.56 |
|
| Affluent Executives, Family Areas |
1.34% |
4.43% |
30.23 |
|
| Well-Off Workers, Family Areas |
7.52% |
7.27% |
103.44 |
|
| Affluent Urbanites, Town & City Areas |
0.00% |
2.56% |
0.00 |
|
| Prosperous Professionals, Metropolitan Areas |
0.00% |
2.04% |
0.00 |
|
| Better-Off Executives, Inner City Areas |
0.14% |
3.94% |
3.51 |
|
| Comfortable Middle Agers, Mature Home Owning Areas |
7.70% |
13.04% |
59.04 |
|
| Skilled Workers, Home Owning Areas |
34.62% |
12.70% |
272.56 |
|
| New Home Owners, Mature Communities |
12.45% |
8.14% |
152.86 |
|
| White Collar Workers, Better-Off Multi Ethnic Areas |
1.70% |
4.02% |
42.35 |
|
| Older People, Less Prosperous Areas |
3.85% |
3.19% |
121.02 |
|
| Council Estate Residents, Better-Off Homes |
16.91% |
11.31% |
149.50 |
|
| Council Estate Residents, High Unemployment |
0.07% |
3.06% |
2.39 |
|
| Council Estate Residents, Greatest Hardship |
3.70% |
2.52% |
147.06 |
|
| People in Multi-Ethnic, Low-Income Areas |
0.00% |
2.10% |
0.00 |
|
| Unclassified |
0.01% |
0.06% |
16.79 |
|
|
 |
 |
 |
| £0-5K |
11.49% |
9.41% |
122.11 |
|
| £5-10K |
19.54% |
16.63% |
117.47 |
|
| £10-15K |
18.50% |
16.58% |
111.59 |
|
| £15-20K |
14.30% |
13.58% |
105.29 |
|
| £20-25K |
10.29% |
10.39% |
99.01 |
|
| £25-30K |
7.23% |
7.77% |
93.00 |
|
| £30-35K |
5.06% |
5.79% |
87.38 |
|
| £35-40K |
3.56% |
4.33% |
82.21 |
|
| £40-45K |
2.53% |
3.27% |
77.49 |
|
| £45-50K |
1.82% |
2.48% |
73.21 |
|
| £50-55K |
1.32% |
1.90% |
69.34 |
|
| £55-60K |
0.97% |
1.47% |
65.83 |
|
| £60-65K |
0.72% |
1.15% |
62.65 |
|
| £65-70K |
0.54% |
0.91% |
59.77 |
|
| £70-75K |
0.41% |
0.72% |
57.14 |
|
| £75-80K |
0.31% |
0.57% |
54.75 |
|
| £80-85K |
0.24% |
0.46% |
52.56 |
|
| £85-90K |
0.19% |
0.37% |
50.56 |
|
| £90-95K |
0.15% |
0.31% |
48.71 |
|
| £95-100K |
0.12% |
0.25% |
47.01 |
|
| £100K + |
0.52% |
1.34% |
38.93 |
|
|
|

|


|
1992-1997
|
1997-2001
|
|
|
|
| Con |
-12.59% |
| Lab |
18.43% |
| LD |
-10.32% |
|
| Con |
2.49% |
| Lab |
-7.21% |
| LD |
6.57% |
|
|
 |
Derek Foster
Labour hold
|
| Con |
 |
8,754 |
22.70% |
| Lab |
 |
22,680 |
58.82% |
| LD |
 |
6,073 |
15.75% |
| Oth |
 |
1,052 |
2.73% |
| Maj |
 |
13,926 |
36.12% |
| Turn |
 |
38,559 |
57.23% |
|
|
 |
Derek Foster
Labour hold
|
| Green |
Carl Bennett |
1,052 |
2.73% |
| LD |
Chris Foote Wood |
6,073 |
15.75% |
| L |
Derek Foster |
22,680 |
58.82% |
| C |
Fiona McNish |
8,754 |
22.70% |
|
Candidates representing 4 parties stood for election to this seat.
|
|
 |
Derek Foster
Labour
|
| Con |
 |
9,295 |
20.21% |
| Lab |
 |
30,359 |
66.03% |
| LD |
 |
4,223 |
9.18% |
| Ref |
 |
2,104 |
4.58% |
| Oth |
|
0 |
0.00% |
| Maj |
 |
21,064 |
45.81% |
| Turn |
 |
45,981 |
68.88% |
|
|
 |
|
Labour
|
| Con |
 |
17,109 |
32.80% |
| Lab |
 |
24,825 |
47.60% |
| LD |
 |
10,184 |
19.50% |
| Oth |
|
0 |
0.00% |
| Maj |
 |
7,716 |
14.80% |
| Turn |
 |
52,118 |
75.98% |
|
|
 |
|

|

