|
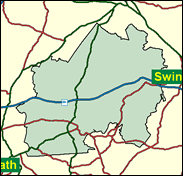
Wiltshire North
Conservative hold

The Conservatives have not in living memory lost this seat, previously named Chippenham, but they have come close. In the 1962 by-election caused by the resignation of Sir David Eccles, a victim of Macmillan's Night of the Long Knives, and again in 1964 and 1966 Daniel Awdry held off the Liberals by wafer thin margins, just 694 in the last year when they were at their weakest. Then for 30 years things got better for the Conservatives, especially under Richard Needham, the eccentric but very bright member from 1979, and in 1997 James Gray took over with a margin of three and a half thousand - not princely, but better than in many western parts that year. In May 1999 the Lib Dems again came out on top in the local North Wiltshire district council elections, winning in Malmesbury, Purton, Corsham, Cricklade and wards of the larger towns Calne and Chippenham. However, the evidence from the county council elections which took place on the same day and with the same turnout, indeed the same voters, as the 1997 General Election demonstrates that people split their vote in favour of the Liberal Democrats here. This suggests that close as they get, they are doomed to disappointment in parliamentary contests in North Wiltshire.

John Gray, a Whip, elected here in 1992, is an itinerant Scot, if of the impeccably anglicised genre, as distinct from the more Caledonian-brogued Sir Teddy Taylor and Eric Forth. Born into the Scots Presbyterian establishment, his father was Minister of Dunblane Cathedral and Moderator of the General Assembly of the Church of Scotland, and he attended fee-paying Glasgow High School, Glasgow University and Christ Church, Oxford. Phobic on devolution and fox hunting bans, a futures broker-turned-political consultant, his tall, good-looking, statesmanlike mien, and urbanely modulated voice, suggest at least middle rank placing in a Conservative administration of the 1950s. Entertaining hopes here for the Liberal Democrats is broadcaster Hugh Pym, a familiar face when he was News at Ten's Westminster correspondent before going freelance. A doctor's son, Marlborough and Oxford-educated, and brought up locally in Malmesbury, where his politically active Liberal Democrat mother still lives, his attributes as a personable media-known favourite-son should cause the Conservatives some concern.
 |
| Wealthy Achievers, Suburban Areas |
30.23% |
14.99% |
201.64 |
|
| Affluent Greys, Rural Communities |
1.30% |
2.13% |
61.08 |
|
| Prosperous Pensioners, Retirement Areas |
1.06% |
2.49% |
42.49 |
|
| Affluent Executives, Family Areas |
14.72% |
4.43% |
332.64 |
|
| Well-Off Workers, Family Areas |
9.27% |
7.27% |
127.42 |
|
| Affluent Urbanites, Town & City Areas |
0.18% |
2.56% |
6.97 |
|
| Prosperous Professionals, Metropolitan Areas |
0.00% |
2.04% |
0.00 |
|
| Better-Off Executives, Inner City Areas |
0.10% |
3.94% |
2.58 |
|
| Comfortable Middle Agers, Mature Home Owning Areas |
15.83% |
13.04% |
121.41 |
|
| Skilled Workers, Home Owning Areas |
9.07% |
12.70% |
71.40 |
|
| New Home Owners, Mature Communities |
10.01% |
8.14% |
122.87 |
|
| White Collar Workers, Better-Off Multi Ethnic Areas |
1.84% |
4.02% |
45.65 |
|
| Older People, Less Prosperous Areas |
2.30% |
3.19% |
72.17 |
|
| Council Estate Residents, Better-Off Homes |
3.41% |
11.31% |
30.13 |
|
| Council Estate Residents, High Unemployment |
0.67% |
3.06% |
21.80 |
|
| Council Estate Residents, Greatest Hardship |
0.02% |
2.52% |
0.64 |
|
| People in Multi-Ethnic, Low-Income Areas |
0.00% |
2.10% |
0.00 |
|
| Unclassified |
0.01% |
0.06% |
19.83 |
|
|
 |
 |
 |
| £0-5K |
5.99% |
9.41% |
63.66 |
|
| £5-10K |
12.79% |
16.63% |
76.92 |
|
| £10-15K |
14.77% |
16.58% |
89.11 |
|
| £15-20K |
13.52% |
13.58% |
99.53 |
|
| £20-25K |
11.23% |
10.39% |
108.08 |
|
| £25-30K |
8.94% |
7.77% |
114.95 |
|
| £30-35K |
6.97% |
5.79% |
120.38 |
|
| £35-40K |
5.40% |
4.33% |
124.62 |
|
| £40-45K |
4.18% |
3.27% |
127.89 |
|
| £45-50K |
3.24% |
2.48% |
130.39 |
|
| £50-55K |
2.52% |
1.90% |
132.25 |
|
| £55-60K |
1.97% |
1.47% |
133.62 |
|
| £60-65K |
1.55% |
1.15% |
134.59 |
|
| £65-70K |
1.23% |
0.91% |
135.24 |
|
| £70-75K |
0.98% |
0.72% |
135.64 |
|
| £75-80K |
0.78% |
0.57% |
135.85 |
|
| £80-85K |
0.63% |
0.46% |
135.89 |
|
| £85-90K |
0.51% |
0.37% |
135.82 |
|
| £90-95K |
0.41% |
0.31% |
135.65 |
|
| £95-100K |
0.34% |
0.25% |
135.41 |
|
| £100K + |
1.78% |
1.34% |
132.73 |
|
|
|

|


|
1992-1997
|
1997-2001
|
|
|
|
| Con |
-12.43% |
| Lab |
4.04% |
| LD |
6.28% |
|
| Con |
1.73% |
| Lab |
0.03% |
| LD |
0.40% |
|
|
 |
James Gray
Conservative hold
|
| Con |
 |
24,090 |
45.50% |
| Lab |
 |
7,556 |
14.27% |
| LD |
 |
20,212 |
38.17% |
| Oth |
 |
1,090 |
2.06% |
| Maj |
 |
3,878 |
7.32% |
| Turn |
 |
52,948 |
66.58% |
|
|
 |
James Gray
Conservative hold
|
| UK |
Neil Dowdney |
1,090 |
2.06% |
| L |
Jo Garton |
7,556 |
14.27% |
| C |
James Gray |
24,090 |
45.50% |
| LD |
Hugh Pym |
20,212 |
38.17% |
|
Candidates representing 4 parties stood for election to this seat.
|
|
 |
James Gray
Conservative
|
| Con |
 |
25,390 |
43.77% |
| Lab |
 |
8,261 |
14.24% |
| LD |
 |
21,915 |
37.78% |
| Ref |
 |
1,774 |
3.06% |
| Oth |
 |
673 |
1.16% |
| Maj |
 |
3,475 |
5.99% |
| Turn |
 |
58,013 |
75.11% |
|
|
 |
|
Conservative
|
| Con |
 |
33,626 |
56.20% |
| Lab |
 |
6,087 |
10.20% |
| LD |
 |
18,866 |
31.50% |
| Oth |
 |
1,287 |
2.10% |
| Maj |
 |
14,760 |
24.70% |
| Turn |
 |
59,866 |
83.95% |
|
|
 |
|

|

