|
Wimbledon
Labour hold

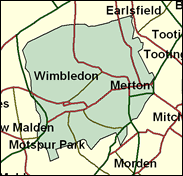
One of the most unexpected Labour gains in 1997, on a swing of no less than 18pc, Wimbledon may be thought to be a certain Conservative regain. This is the most likely outcome, but we should not be over-hasty. In the Merton Borough elections of 1998, of which this seat formed half, Labour retained control of the council easily and polled almost as many votes as the Tories in the Wimbledon wards. An Evening Standard poll in November 2000 suggested no overall movement in the parties' respective shares of the Greater London vote. Roger Casale may yet obtain an almost equally surprising second term in outer SW London.

Roger Casale, a Europhile lecturer elected here in 1997, routinely suffers Conservative mockery and derision when he rises to speak, on the "shurely shome mishtake" principle of having the effrontery to be a Labour MP in Wimbledon, and with a public-school (Hurstpierpoint) and Oxford (Brasenose) pedigree to boot. Born 1960, his loyalist interventions have something of an unpractised air, notably when he thanked the government for "wiring up children (in a school in Wimbledon) to computers." To oust him, the Conservatives are fielding a merchant banker, Stephen Hammond, born 1962, educated at King Edward VI School, Southampton and Queen Mary College, London. A Bow Grouper and member of the Centre for Policy Studies, he is currently with Commerzbank Global Equities.
 |
| Wealthy Achievers, Suburban Areas |
12.30% |
14.99% |
82.04 |
|
| Affluent Greys, Rural Communities |
0.00% |
2.13% |
0.00 |
|
| Prosperous Pensioners, Retirement Areas |
0.64% |
2.49% |
25.80 |
|
| Affluent Executives, Family Areas |
0.00% |
4.43% |
0.00 |
|
| Well-Off Workers, Family Areas |
0.01% |
7.27% |
0.19 |
|
| Affluent Urbanites, Town & City Areas |
14.52% |
2.56% |
566.16 |
|
| Prosperous Professionals, Metropolitan Areas |
37.06% |
2.04% |
1,815.89 |
|
| Better-Off Executives, Inner City Areas |
8.03% |
3.94% |
203.72 |
|
| Comfortable Middle Agers, Mature Home Owning Areas |
4.60% |
13.04% |
35.29 |
|
| Skilled Workers, Home Owning Areas |
9.54% |
12.70% |
75.09 |
|
| New Home Owners, Mature Communities |
1.51% |
8.14% |
18.54 |
|
| White Collar Workers, Better-Off Multi Ethnic Areas |
8.09% |
4.02% |
201.23 |
|
| Older People, Less Prosperous Areas |
0.06% |
3.19% |
1.93 |
|
| Council Estate Residents, Better-Off Homes |
0.04% |
11.31% |
0.36 |
|
| Council Estate Residents, High Unemployment |
2.52% |
3.06% |
82.39 |
|
| Council Estate Residents, Greatest Hardship |
0.00% |
2.52% |
0.00 |
|
| People in Multi-Ethnic, Low-Income Areas |
1.06% |
2.10% |
50.35 |
|
| Unclassified |
0.00% |
0.06% |
0.00 |
|
|
 |
 |
 |
| £0-5K |
3.08% |
9.41% |
32.69 |
|
| £5-10K |
7.50% |
16.63% |
45.09 |
|
| £10-15K |
10.07% |
16.58% |
60.73 |
|
| £15-20K |
10.66% |
13.58% |
78.45 |
|
| £20-25K |
10.10% |
10.39% |
97.20 |
|
| £25-30K |
9.04% |
7.77% |
116.28 |
|
| £30-35K |
7.83% |
5.79% |
135.21 |
|
| £35-40K |
6.66% |
4.33% |
153.68 |
|
| £40-45K |
5.60% |
3.27% |
171.50 |
|
| £45-50K |
4.68% |
2.48% |
188.56 |
|
| £50-55K |
3.90% |
1.90% |
204.82 |
|
| £55-60K |
3.25% |
1.47% |
220.27 |
|
| £60-65K |
2.70% |
1.15% |
234.92 |
|
| £65-70K |
2.26% |
0.91% |
248.80 |
|
| £70-75K |
1.88% |
0.72% |
261.94 |
|
| £75-80K |
1.58% |
0.57% |
274.40 |
|
| £80-85K |
1.32% |
0.46% |
286.20 |
|
| £85-90K |
1.11% |
0.37% |
297.40 |
|
| £90-95K |
0.94% |
0.31% |
308.03 |
|
| £95-100K |
0.80% |
0.25% |
318.13 |
|
| £100K + |
5.01% |
1.34% |
372.64 |
|
|
|

|


|
1992-1997
|
1997-2001
|
|
|
|
| Con |
-16.41% |
| Lab |
19.46% |
| LD |
-4.73% |
|
| Con |
0.05% |
| Lab |
2.99% |
| LD |
-3.58% |
|
|
 |
Roger Casale
Labour hold
|
| Con |
 |
15,062 |
36.64% |
| Lab |
 |
18,806 |
45.75% |
| LD |
 |
5,341 |
12.99% |
| Oth |
 |
1,900 |
4.62% |
| Maj |
 |
3,744 |
9.11% |
| Turn |
 |
41,109 |
64.30% |
|
|
 |
Roger Casale
Labour hold
|
| UK |
Mariana Bell |
414 |
1.01% |
| L |
Roger Casale |
18,806 |
45.75% |
| CPA |
Roger Glencross |
479 |
1.17% |
| C |
Stephen Hammond |
15,062 |
36.64% |
| LD |
Martin Pierce |
5,341 |
12.99% |
| G |
Rajeev Thacker |
1,007 |
2.45% |
|
Candidates representing 6 parties stood for election to this seat.
|
|
 |
Roger Casale
Labour gain
|
| Con |
 |
17,694 |
36.59% |
| Lab |
 |
20,674 |
42.76% |
| LD |
 |
8,014 |
16.57% |
| Ref |
 |
993 |
2.05% |
| Oth |
 |
979 |
2.02% |
| Maj |
 |
2,980 |
6.16% |
| Turn |
 |
48,354 |
75.47% |
|
|
 |
|
Conservative
|
| Con |
 |
26,331 |
53.00% |
| Lab |
 |
11,570 |
23.30% |
| LD |
 |
10,569 |
21.30% |
| Oth |
 |
1,211 |
2.40% |
| Maj |
 |
14,761 |
29.70% |
| Turn |
 |
49,681 |
81.94% |
|
|
 |
|

|

