|
Windsor
Conservative hold

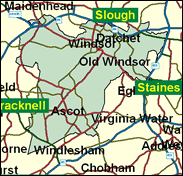
An aristocratic, even royal name, for a very elite seat. Windsor also includes Eton, the site of probably the most famous boys school in the world, Ascot with its Crown Estate mansions and the most fashionable (in every sense) of racecourses, and Sunningdale and Sunninghill, and also the Thames-side Bray, with its luxury restaurants such as Michel Roux's Waterside Inn and a newer contender, Heston Blumenthal's Fat Duck. Many celebrities, indeed 'stars' live in Bray, of the magnitude of Michael and Mary Parkinson and Rolf Harris. Given such splendour, it is only fitting that this constituency elects a Conservative from a distinguished family, Michael Trend, the son of Lord (Burke) Trend. The Liberal Democrats do very well in the more plebeian parts of the seat such as Clewer and parts of Windsor itself, at least on the local government unitary authority, but it is the Conservatives who benefit from all the electoral and sociological trends here.

Michael Trend, son of Harold Wilson's Cabinet Secretary, Sir Burke Trend, was elected MP here in 1992. A tall, heavily-built, former journalist, eventually on The Daily Telegraph, he was born in 1952, and attended Westminster School and Oriel College, Oxford. A restrained churchy Tory of traditional mien, as Deputy Party Chairman under Brian Mawhinney he sought to hold together Europhile and Eurosceptic wings and was only moderately Eurosceptic as a foreign affairs spokesman 1998-99. He has - inevitably - to reflect local concern about aircraft noise over Windsor.
 |
| Wealthy Achievers, Suburban Areas |
35.85% |
14.99% |
239.10 |
|
| Affluent Greys, Rural Communities |
0.00% |
2.13% |
0.00 |
|
| Prosperous Pensioners, Retirement Areas |
2.11% |
2.49% |
84.86 |
|
| Affluent Executives, Family Areas |
10.90% |
4.43% |
246.29 |
|
| Well-Off Workers, Family Areas |
6.53% |
7.27% |
89.77 |
|
| Affluent Urbanites, Town & City Areas |
4.59% |
2.56% |
179.04 |
|
| Prosperous Professionals, Metropolitan Areas |
4.13% |
2.04% |
202.47 |
|
| Better-Off Executives, Inner City Areas |
1.38% |
3.94% |
34.98 |
|
| Comfortable Middle Agers, Mature Home Owning Areas |
15.40% |
13.04% |
118.13 |
|
| Skilled Workers, Home Owning Areas |
4.82% |
12.70% |
37.92 |
|
| New Home Owners, Mature Communities |
2.19% |
8.14% |
26.86 |
|
| White Collar Workers, Better-Off Multi Ethnic Areas |
2.44% |
4.02% |
60.57 |
|
| Older People, Less Prosperous Areas |
1.46% |
3.19% |
45.86 |
|
| Council Estate Residents, Better-Off Homes |
7.06% |
11.31% |
62.39 |
|
| Council Estate Residents, High Unemployment |
0.84% |
3.06% |
27.53 |
|
| Council Estate Residents, Greatest Hardship |
0.19% |
2.52% |
7.58 |
|
| People in Multi-Ethnic, Low-Income Areas |
0.00% |
2.10% |
0.00 |
|
| Unclassified |
0.12% |
0.06% |
185.32 |
|
|
 |
 |
 |
| £0-5K |
4.16% |
9.41% |
44.24 |
|
| £5-10K |
8.82% |
16.63% |
53.04 |
|
| £10-15K |
11.10% |
16.58% |
66.98 |
|
| £15-20K |
11.27% |
13.58% |
82.99 |
|
| £20-25K |
10.36% |
10.39% |
99.70 |
|
| £25-30K |
9.04% |
7.77% |
116.32 |
|
| £30-35K |
7.67% |
5.79% |
132.42 |
|
| £35-40K |
6.40% |
4.33% |
147.74 |
|
| £40-45K |
5.29% |
3.27% |
162.17 |
|
| £45-50K |
4.36% |
2.48% |
175.65 |
|
| £50-55K |
3.58% |
1.90% |
188.18 |
|
| £55-60K |
2.95% |
1.47% |
199.80 |
|
| £60-65K |
2.42% |
1.15% |
210.55 |
|
| £65-70K |
2.00% |
0.91% |
220.47 |
|
| £70-75K |
1.65% |
0.72% |
229.63 |
|
| £75-80K |
1.37% |
0.57% |
238.08 |
|
| £80-85K |
1.14% |
0.46% |
245.88 |
|
| £85-90K |
0.95% |
0.37% |
253.07 |
|
| £90-95K |
0.79% |
0.31% |
259.71 |
|
| £95-100K |
0.66% |
0.25% |
265.84 |
|
| £100K + |
3.94% |
1.34% |
293.13 |
|
|
|

|


|
1992-1997
|
1997-2001
|
|
|
|
| Con |
-8.10% |
| Lab |
5.89% |
| LD |
-0.43% |
|
| Con |
13.58% |
| Lab |
13.18% |
| LD |
-25.22% |
|
|
 |
Michael Trend
Conservative hold
|
| Con |
 |
19,900 |
61.78% |
| Lab |
 |
10,137 |
31.47% |
| LD |
 |
1,111 |
3.45% |
| Oth |
 |
1,062 |
3.30% |
| Maj |
 |
9,763 |
30.31% |
| Turn |
 |
32,210 |
46.59% |
|
|
 |
Michael Trend
Conservative hold
|
| UK |
John Fagan |
1,062 |
3.30% |
| L |
Mark Muller |
10,137 |
31.47% |
| LD |
Nick Pinfield |
1,111 |
3.45% |
| C |
Michael Trend |
19,900 |
61.78% |
|
Candidates representing 4 parties stood for election to this seat.
|
|
 |
Michael Trend
Conservative
|
| Con |
 |
24,476 |
48.20% |
| Lab |
 |
9,287 |
18.29% |
| LD |
 |
14,559 |
28.67% |
| Ref |
 |
1,676 |
3.30% |
| Oth |
 |
783 |
1.54% |
| Maj |
 |
9,917 |
19.53% |
| Turn |
 |
50,781 |
73.46% |
|
|
 |
|
Conservative
|
| Con |
 |
30,138 |
56.30% |
| Lab |
 |
6,645 |
12.40% |
| LD |
 |
15,587 |
29.10% |
| Oth |
 |
1,184 |
2.20% |
| Maj |
 |
14,551 |
27.20% |
| Turn |
 |
53,554 |
79.29% |
|
|
 |
|

|

