|
Wirral West
Labour hold

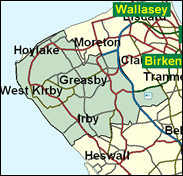
Traditionally considering itself far removed from the salty and scouse atmosphere of the city in which many of its residents work, the north western corner of the Wirral peninsula centred on Hoylake and West Kirby - not West Kirkby note, and very definitely not Kirkby - shocked many including many of its own residents by falling to Labour in the 1997 landslide. Another Tory of Cabinet rank was cast adrift, David Hunt. Merseyside appeared to have come to Cheshire. Can this happen again - or will the red, or at least pink tide, be rolled back from whence it came? Local elections since 1997 suggest a return to the established order of things is the most likely outcome, should the Conservatives gain even a couple of dozen seats in 2001; but, whisper it soft and in modulated tones, even that is not absolutely certain.

Stephen Hesford, a Gray's Inn barrister who happens to be a Labour MP rather than vice versa, is an unobtrusive Labour backbencher elected in 1997. His opposition to grammar schools led to unfounded allegations of his using private schools for his own children. He was born in 1951 and educated at Urmston Grammar School, Bradford University, Central London Polytechnic and the Inns of Court School of Law. The boyish-looking Conservative candidate, Chris Lynch, a Manchester-based chartered accountant originally with Ernst & Young and latterly with Price Waterhouse Coopers, was born in 1963 and educated at St. Richard of Chichester Secondary School, London and Manchester University and boasts a season ticket to Wirral-based Tranmere Rovers Football Club. He wants "never" to abolish the pound.
 |
| Wealthy Achievers, Suburban Areas |
28.00% |
14.99% |
186.77 |
|
| Affluent Greys, Rural Communities |
0.00% |
2.13% |
0.00 |
|
| Prosperous Pensioners, Retirement Areas |
3.38% |
2.49% |
136.07 |
|
| Affluent Executives, Family Areas |
3.91% |
4.43% |
88.45 |
|
| Well-Off Workers, Family Areas |
9.67% |
7.27% |
132.94 |
|
| Affluent Urbanites, Town & City Areas |
4.07% |
2.56% |
158.52 |
|
| Prosperous Professionals, Metropolitan Areas |
0.07% |
2.04% |
3.34 |
|
| Better-Off Executives, Inner City Areas |
0.39% |
3.94% |
9.87 |
|
| Comfortable Middle Agers, Mature Home Owning Areas |
31.61% |
13.04% |
242.40 |
|
| Skilled Workers, Home Owning Areas |
1.02% |
12.70% |
8.02 |
|
| New Home Owners, Mature Communities |
3.37% |
8.14% |
41.39 |
|
| White Collar Workers, Better-Off Multi Ethnic Areas |
2.08% |
4.02% |
51.77 |
|
| Older People, Less Prosperous Areas |
2.93% |
3.19% |
92.11 |
|
| Council Estate Residents, Better-Off Homes |
8.44% |
11.31% |
74.59 |
|
| Council Estate Residents, High Unemployment |
1.06% |
3.06% |
34.55 |
|
| Council Estate Residents, Greatest Hardship |
0.00% |
2.52% |
0.00 |
|
| People in Multi-Ethnic, Low-Income Areas |
0.00% |
2.10% |
0.00 |
|
| Unclassified |
0.00% |
0.06% |
0.00 |
|
|
 |
 |
 |
| £0-5K |
8.43% |
9.41% |
89.56 |
|
| £5-10K |
15.13% |
16.63% |
91.00 |
|
| £10-15K |
15.75% |
16.58% |
95.00 |
|
| £15-20K |
13.46% |
13.58% |
99.11 |
|
| £20-25K |
10.66% |
10.39% |
102.59 |
|
| £25-30K |
8.19% |
7.77% |
105.35 |
|
| £30-35K |
6.22% |
5.79% |
107.47 |
|
| £35-40K |
4.73% |
4.33% |
109.07 |
|
| £40-45K |
3.60% |
3.27% |
110.25 |
|
| £45-50K |
2.76% |
2.48% |
111.11 |
|
| £50-55K |
2.13% |
1.90% |
111.70 |
|
| £55-60K |
1.65% |
1.47% |
112.07 |
|
| £60-65K |
1.29% |
1.15% |
112.28 |
|
| £65-70K |
1.02% |
0.91% |
112.35 |
|
| £70-75K |
0.81% |
0.72% |
112.31 |
|
| £75-80K |
0.64% |
0.57% |
112.18 |
|
| £80-85K |
0.52% |
0.46% |
111.97 |
|
| £85-90K |
0.42% |
0.37% |
111.71 |
|
| £90-95K |
0.34% |
0.31% |
111.39 |
|
| £95-100K |
0.28% |
0.25% |
111.04 |
|
| £100K + |
1.45% |
1.34% |
107.85 |
|
|
|

|


|
1992-1997
|
1997-2001
|
|
|
|
| Con |
-13.68% |
| Lab |
13.86% |
| LD |
-1.92% |
|
| Con |
-1.79% |
| Lab |
2.34% |
| LD |
2.89% |
|
|
 |
Stephen Hesford
Labour hold
|
| Con |
 |
15,070 |
37.23% |
| Lab |
 |
19,105 |
47.20% |
| LD |
 |
6,300 |
15.57% |
| Oth |
|
0 |
0.00% |
| Maj |
 |
4,035 |
9.97% |
| Turn |
 |
40,475 |
64.97% |
|
|
 |
Stephen Hesford
Labour hold
|
| L |
Stephen Hesford |
19,105 |
47.20% |
| LD |
Simon Holbrook |
6,300 |
15.57% |
| C |
Chris Lynch |
15,070 |
37.23% |
|
Candidates representing 3 parties stood for election to this seat.
|
|
 |
Stephen Hesford
Labour gain
|
| Con |
 |
18,297 |
39.02% |
| Lab |
 |
21,035 |
44.86% |
| LD |
 |
5,945 |
12.68% |
| Ref |
 |
1,613 |
3.44% |
| Oth |
|
0 |
0.00% |
| Maj |
 |
2,738 |
5.84% |
| Turn |
 |
46,890 |
76.98% |
|
|
 |
|
Conservative
|
| Con |
 |
26,852 |
52.70% |
| Lab |
 |
15,788 |
31.00% |
| LD |
 |
7,420 |
14.60% |
| Oth |
 |
888 |
1.70% |
| Maj |
 |
11,064 |
21.70% |
| Turn |
 |
50,948 |
80.37% |
|
|
 |
|

|

