|
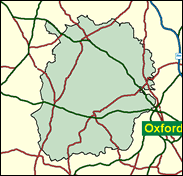
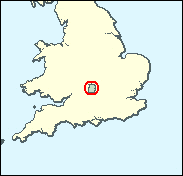
Witney
Conservative hold

Witney will almost certainly have a new MP after the next general election, but it may not technically represent a change from the last General Election. The reason is that the Conservative MP elected then, Shaun Woodward, defected to Labour in 1999, but he is not attempting to fight this seat again. The likely winner is another new Conservative, David Cameron, who is more likely both to retain his allegiance and to serve more than one term for this solidly Tory part of West Oxfordshire.

David Cameron, selected to replace the floor-crossing Shaun Woodward, is like the defector, a former party staffer, who was at Central Office for four years up to the 1992 election and a Treasury and Home Office adviser 1992-94, and thereafter Head of Corporate Affairs at Carlton Television. Born 1966, he is a rare Old Etonian (one of only four selected as replacements for MPs in 25 safe Tory seats) who then proceeded to Brasenose College, Oxford. Effortlessly smooth, he was expected to win at Stafford in 1997 (where he opposed the single currency and further European integration), but fell victim to the Labour flood. His great-great-grandfather, and his great-grandfather, were successively Conservative MPs for Newbury between 1885 and 1922.
 |
| Wealthy Achievers, Suburban Areas |
29.83% |
14.99% |
198.93 |
|
| Affluent Greys, Rural Communities |
3.36% |
2.13% |
157.90 |
|
| Prosperous Pensioners, Retirement Areas |
0.64% |
2.49% |
25.63 |
|
| Affluent Executives, Family Areas |
13.14% |
4.43% |
296.95 |
|
| Well-Off Workers, Family Areas |
13.71% |
7.27% |
188.49 |
|
| Affluent Urbanites, Town & City Areas |
0.48% |
2.56% |
18.56 |
|
| Prosperous Professionals, Metropolitan Areas |
0.83% |
2.04% |
40.82 |
|
| Better-Off Executives, Inner City Areas |
0.00% |
3.94% |
0.00 |
|
| Comfortable Middle Agers, Mature Home Owning Areas |
19.10% |
13.04% |
146.52 |
|
| Skilled Workers, Home Owning Areas |
2.51% |
12.70% |
19.78 |
|
| New Home Owners, Mature Communities |
9.54% |
8.14% |
117.12 |
|
| White Collar Workers, Better-Off Multi Ethnic Areas |
2.00% |
4.02% |
49.81 |
|
| Older People, Less Prosperous Areas |
1.91% |
3.19% |
59.93 |
|
| Council Estate Residents, Better-Off Homes |
2.84% |
11.31% |
25.13 |
|
| Council Estate Residents, High Unemployment |
0.05% |
3.06% |
1.76 |
|
| Council Estate Residents, Greatest Hardship |
0.00% |
2.52% |
0.00 |
|
| People in Multi-Ethnic, Low-Income Areas |
0.00% |
2.10% |
0.00 |
|
| Unclassified |
0.06% |
0.06% |
89.29 |
|
|
 |
|
|
| £0-5K |
5.26% |
9.41% |
55.87 |
|
| £5-10K |
11.85% |
16.63% |
71.24 |
|
| £10-15K |
14.34% |
16.58% |
86.50 |
|
| £15-20K |
13.54% |
13.58% |
99.72 |
|
| £20-25K |
11.48% |
10.39% |
110.49 |
|
| £25-30K |
9.25% |
7.77% |
119.00 |
|
| £30-35K |
7.27% |
5.79% |
125.60 |
|
| £35-40K |
5.66% |
4.33% |
130.62 |
|
| £40-45K |
4.39% |
3.27% |
134.40 |
|
| £45-50K |
3.41% |
2.48% |
137.19 |
|
| £50-55K |
2.65% |
1.90% |
139.21 |
|
| £55-60K |
2.07% |
1.47% |
140.62 |
|
| £60-65K |
1.63% |
1.15% |
141.58 |
|
| £65-70K |
1.29% |
0.91% |
142.17 |
|
| £70-75K |
1.02% |
0.72% |
142.49 |
|
| £75-80K |
0.82% |
0.57% |
142.59 |
|
| £80-85K |
0.66% |
0.46% |
142.53 |
|
| £85-90K |
0.53% |
0.37% |
142.35 |
|
| £90-95K |
0.43% |
0.31% |
142.07 |
|
| £95-100K |
0.35% |
0.25% |
141.72 |
|
| £100K + |
1.86% |
1.34% |
138.43 |
|
|
|
|


|
1992-1997
|
1997-2001
|
|
|
|
| Con |
-14.75% |
| Lab |
12.49% |
| LD |
-2.64% |
|
| Con |
1.97% |
| Lab |
-1.77% |
| LD |
0.46% |
|
|
|
David Cameron
Conservative hold
|
| Con |
 |
22,153 |
45.02% |
| Lab |
 |
14,180 |
28.82% |
| LD |
 |
10,000 |
20.32% |
| Oth |
 |
2,870 |
5.83% |
| Maj |
 |
7,973 |
16.20% |
| Turn |
|
49,203 |
65.93% |
|
|
|
David Cameron
Conservative hold
|
| L |
Michael Bartlet |
14,180 |
28.82% |
| I |
Barry Beadle |
1,003 |
2.04% |
| C |
David Cameron |
22,153 |
45.02% |
| UK |
Kenneth Dukes |
767 |
1.56% |
| LD |
Gareth Epps |
10,000 |
20.32% |
| G |
Mark Stevenson |
1,100 |
2.24% |
|
Candidates representing 6 parties stood for election to this seat.
|
|
|
Shaun Woodward
Conservative
|
| Con |
|
24,282 |
43.05% |
| Lab |
|
17,254 |
30.59% |
| LD |
|
11,202 |
19.86% |
| Ref |
 |
2,262 |
4.01% |
| Oth |
|
1,401 |
2.48% |
| Maj |
|
7,028 |
12.46% |
| Turn |
|
56,401 |
76.72% |
|
|
|
|
Conservative
|
| Con |
|
33,743 |
57.80% |
| Lab |
|
10,582 |
18.10% |
| LD |
|
13,150 |
22.50% |
| Oth |
|
895 |
1.50% |
| Maj |
|
20,593 |
35.30% |
| Turn |
|
58,370 |
83.69% |
|
|
|
|
|