|
Woking
Conservative hold

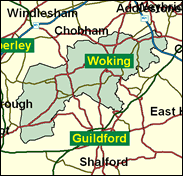
Woking is the largest town in Surrey, with a population of 84,000 in the last Census, including as the borough and the constituency do surrounding communities like Byfleet and Sheerwater. It is large enough for internal disparities to be identified. Central and Maybury ward was one third non-white as self-ascribed in the 1991 Census , three times as high as any other in the county of Surrey. Goldsworth Park grew rapidly with private housing construction in the 1980s. The Conservatives do best in Horsell and Pyrford wards, and in West Byfleet. Sheerwater is a council estate Labour stronghold. Yet in 1997 a strange result occurred which demands a different kind of analysis. The new Conservative candidate Humfrey Malins suffered a loss of share compared with 1992 of over 20pc, exceeded only in two places: Tatton, where Neil Hamilton face the Independent candidature of Martin Bell, and Gordon, where the notion for 1992 was probably wrongly calculated. The plummet in Woking seems due to the 6,142 votes (12pc of the total) polled between them by an Independent Conservative and the Referendum party. This unfortunate conjunction is unlikely to be in Malins's stars again, and his fate may be forecast as an increased majority. He was lucky in one sense: both Liberal Democrats and Labour have strong bases here, and between them they divided the other-than-gadfly opposition in 1997 and are likely to do so again.

Humfrey Malins was returned as MP for this seat in 1997 having earlier been MP for Croydon NW (1983-92). A solicitor-risen-to-Recorder, born 1945, he attended the churchy minor public school, St John's, Leatherhead, and Brasenose College, Oxford. A socially-conscious One Nation Tory, he relocated rightwards to vote for Hague in 1997, and as founder of the Immigration Advisory Service, seeks to address the problem without recourse to a Dutch-auction on asylum seeker expulsion, and is also concerned at the link between drug dependence and crime.
 |
| Wealthy Achievers, Suburban Areas |
41.87% |
14.99% |
279.25 |
|
| Affluent Greys, Rural Communities |
0.00% |
2.13% |
0.00 |
|
| Prosperous Pensioners, Retirement Areas |
1.05% |
2.49% |
42.11 |
|
| Affluent Executives, Family Areas |
5.80% |
4.43% |
131.07 |
|
| Well-Off Workers, Family Areas |
9.84% |
7.27% |
135.34 |
|
| Affluent Urbanites, Town & City Areas |
4.86% |
2.56% |
189.57 |
|
| Prosperous Professionals, Metropolitan Areas |
3.11% |
2.04% |
152.49 |
|
| Better-Off Executives, Inner City Areas |
0.82% |
3.94% |
20.81 |
|
| Comfortable Middle Agers, Mature Home Owning Areas |
8.06% |
13.04% |
61.79 |
|
| Skilled Workers, Home Owning Areas |
5.50% |
12.70% |
43.34 |
|
| New Home Owners, Mature Communities |
6.27% |
8.14% |
77.00 |
|
| White Collar Workers, Better-Off Multi Ethnic Areas |
0.72% |
4.02% |
17.81 |
|
| Older People, Less Prosperous Areas |
1.44% |
3.19% |
45.17 |
|
| Council Estate Residents, Better-Off Homes |
8.19% |
11.31% |
72.38 |
|
| Council Estate Residents, High Unemployment |
0.41% |
3.06% |
13.35 |
|
| Council Estate Residents, Greatest Hardship |
0.00% |
2.52% |
0.00 |
|
| People in Multi-Ethnic, Low-Income Areas |
1.89% |
2.10% |
90.04 |
|
| Unclassified |
0.17% |
0.06% |
273.98 |
|
|
 |
 |
 |
| £0-5K |
4.40% |
9.41% |
46.76 |
|
| £5-10K |
9.36% |
16.63% |
56.28 |
|
| £10-15K |
11.70% |
16.58% |
70.54 |
|
| £15-20K |
11.72% |
13.58% |
86.31 |
|
| £20-25K |
10.62% |
10.39% |
102.19 |
|
| £25-30K |
9.14% |
7.77% |
117.54 |
|
| £30-35K |
7.65% |
5.79% |
132.03 |
|
| £35-40K |
6.30% |
4.33% |
145.52 |
|
| £40-45K |
5.16% |
3.27% |
157.94 |
|
| £45-50K |
4.20% |
2.48% |
169.31 |
|
| £50-55K |
3.42% |
1.90% |
179.67 |
|
| £55-60K |
2.79% |
1.47% |
189.09 |
|
| £60-65K |
2.28% |
1.15% |
197.63 |
|
| £65-70K |
1.86% |
0.91% |
205.35 |
|
| £70-75K |
1.53% |
0.72% |
212.34 |
|
| £75-80K |
1.26% |
0.57% |
218.64 |
|
| £80-85K |
1.04% |
0.46% |
224.33 |
|
| £85-90K |
0.86% |
0.37% |
229.46 |
|
| £90-95K |
0.71% |
0.31% |
234.08 |
|
| £95-100K |
0.60% |
0.25% |
238.25 |
|
| £100K + |
3.41% |
1.34% |
253.76 |
|
|
|

|


|
1992-1997
|
1997-2001
|
|
|
|
| Con |
-20.70% |
| Lab |
7.61% |
| LD |
0.15% |
|
| Con |
7.62% |
| Lab |
-0.70% |
| LD |
3.02% |
|
|
 |
Humfrey Malins
Conservative hold
|
| Con |
 |
19,747 |
46.02% |
| Lab |
 |
8,714 |
20.31% |
| LD |
 |
12,988 |
30.27% |
| Oth |
 |
1,461 |
3.40% |
| Maj |
 |
6,759 |
15.75% |
| Turn |
 |
42,910 |
60.30% |
|
|
 |
Humfrey Malins
Conservative hold
|
| UK |
Michael Harvey |
1,461 |
3.40% |
| LD |
Alan Hilliar |
12,988 |
30.27% |
| L |
Sabir Hussain |
8,714 |
20.31% |
| C |
Humfrey Malins |
19,747 |
46.02% |
|
Candidates representing 4 parties stood for election to this seat.
|
|
 |
Humphrey Malins
Conservative
|
| Con |
 |
19,553 |
38.40% |
| Lab |
 |
10,695 |
21.01% |
| LD |
 |
13,875 |
27.25% |
| Ref |
 |
2,209 |
4.34% |
| Oth |
 |
4,582 |
9.00% |
| Maj |
 |
5,678 |
11.15% |
| Turn |
 |
50,914 |
72.68% |
|
|
 |
|
Conservative
|
| Con |
 |
32,718 |
59.10% |
| Lab |
 |
7,398 |
13.40% |
| LD |
 |
14,987 |
27.10% |
| Oth |
 |
257 |
0.50% |
| Maj |
 |
17,731 |
32.00% |
| Turn |
 |
55,360 |
79.86% |
|
|
 |
|

|

