|
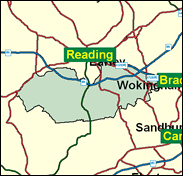
Wokingham
Conservative hold

John Redwood is well nigh certain to win again in Wokingham, despite the opposition of the first competitor to be selected for the Sydney Olympics of 2000, Matthew Syed the British and Commonwealth table tennis number one - who is unlikely to finish higher than the bronze medal spot for Labour here, whatever spin he imparts to his campaign. Syed is at least a local candidate, in that he was brought up in the greatly expanded suburb of Earley, one of the many places in this area where property prices and job opportunities have boomed for quite a few years now. This process seems to be continuing apace, and there are complaints that it is difficult for those in vital but less well paid jobs (nurses, primary school teachers, fire-fighters) to find anywhere affordable to live. This is the kind of problem that will scarcely threaten John Redwood's position in one of the most prosperous and modern of seats.

John Redwood was discarded by William Hague in 2000, after being embraced by Kenneth Clarke in 1997 in a pact likened to the Molotov-Ribbentrop arrangement of 1939. This despite Clarke's earlier claim that with Redwood's brand of "extreme right-wing simplistic ideology" the party would be out of power for a 1,000 years. An intellectual loner, born (1951) as the only child of lower middle class parents, he attended Kent College, Canterbury and Magdalen College and St Anthony's College, Oxford, and acquired a Fellowship of All Soul's. Initially a Rothschild's banker, he headed Margaret Thatcher's No. 10 Policy Unit from 1983 to 1985. With his relationship with Hague already troubled by his pact with Clarke in 1997, things could not have been helped by the revelation that he saw Hague as a man of "trainspotting vacuity overlaid by the gloss of management theory". Routinely described as "half-human, half-Vulcan" he is, as evidenced in his pact with Clarke, a pragmatic professional politician, and could well yet end up as Chancellor in a Clarke government, so long as the Conservative Party doesn't mind its prime ministers being in their late 60s. His rendition as Welsh Secretary of the Welsh national anthem - "My hen wagged a glad eye" - did not impress them in Treorchy.
 |
| Wealthy Achievers, Suburban Areas |
38.52% |
14.99% |
256.90 |
|
| Affluent Greys, Rural Communities |
0.00% |
2.13% |
0.00 |
|
| Prosperous Pensioners, Retirement Areas |
1.83% |
2.49% |
73.63 |
|
| Affluent Executives, Family Areas |
36.08% |
4.43% |
815.36 |
|
| Well-Off Workers, Family Areas |
7.29% |
7.27% |
100.19 |
|
| Affluent Urbanites, Town & City Areas |
1.48% |
2.56% |
57.73 |
|
| Prosperous Professionals, Metropolitan Areas |
1.60% |
2.04% |
78.16 |
|
| Better-Off Executives, Inner City Areas |
0.18% |
3.94% |
4.63 |
|
| Comfortable Middle Agers, Mature Home Owning Areas |
8.53% |
13.04% |
65.38 |
|
| Skilled Workers, Home Owning Areas |
0.14% |
12.70% |
1.07 |
|
| New Home Owners, Mature Communities |
2.25% |
8.14% |
27.66 |
|
| White Collar Workers, Better-Off Multi Ethnic Areas |
0.00% |
4.02% |
0.00 |
|
| Older People, Less Prosperous Areas |
0.21% |
3.19% |
6.54 |
|
| Council Estate Residents, Better-Off Homes |
1.84% |
11.31% |
16.24 |
|
| Council Estate Residents, High Unemployment |
0.02% |
3.06% |
0.63 |
|
| Council Estate Residents, Greatest Hardship |
0.00% |
2.52% |
0.00 |
|
| People in Multi-Ethnic, Low-Income Areas |
0.00% |
2.10% |
0.00 |
|
| Unclassified |
0.05% |
0.06% |
74.05 |
|
|
 |
 |
 |
| £0-5K |
2.86% |
9.41% |
30.35 |
|
| £5-10K |
6.99% |
16.63% |
42.00 |
|
| £10-15K |
9.76% |
16.58% |
58.90 |
|
| £15-20K |
10.66% |
13.58% |
78.47 |
|
| £20-25K |
10.30% |
10.39% |
99.10 |
|
| £25-30K |
9.31% |
7.77% |
119.78 |
|
| £30-35K |
8.10% |
5.79% |
139.86 |
|
| £35-40K |
6.89% |
4.33% |
158.95 |
|
| £40-45K |
5.77% |
3.27% |
176.85 |
|
| £45-50K |
4.80% |
2.48% |
193.48 |
|
| £50-55K |
3.98% |
1.90% |
208.82 |
|
| £55-60K |
3.29% |
1.47% |
222.91 |
|
| £60-65K |
2.72% |
1.15% |
235.82 |
|
| £65-70K |
2.24% |
0.91% |
247.62 |
|
| £70-75K |
1.86% |
0.72% |
258.40 |
|
| £75-80K |
1.54% |
0.57% |
268.23 |
|
| £80-85K |
1.28% |
0.46% |
277.20 |
|
| £85-90K |
1.07% |
0.37% |
285.38 |
|
| £90-95K |
0.89% |
0.31% |
292.84 |
|
| £95-100K |
0.75% |
0.25% |
299.66 |
|
| £100K + |
4.41% |
1.34% |
328.47 |
|
|
|

|


|
1992-1997
|
1997-2001
|
|
|
|
| Con |
-11.64% |
| Lab |
5.51% |
| LD |
5.77% |
|
| Con |
-3.96% |
| Lab |
0.60% |
| LD |
1.06% |
|
|
 |
John Redwood
Conservative hold
|
| Con |
 |
20,216 |
46.10% |
| Lab |
 |
7,633 |
17.41% |
| LD |
 |
14,222 |
32.43% |
| Oth |
 |
1,777 |
4.05% |
| Maj |
 |
5,994 |
13.67% |
| Turn |
 |
43,848 |
64.08% |
|
|
 |
John Redwood
Conservative hold
|
| UK |
Franklin Carstairs |
897 |
2.05% |
| LD |
Royce Longton |
14,222 |
32.43% |
| MR |
Peter "Top Cat" Owen |
880 |
2.01% |
| C |
John Redwood |
20,216 |
46.10% |
| L |
Matthew Syed |
7,633 |
17.41% |
|
Candidates representing 5 parties stood for election to this seat.
|
|
 |
John Redwood
Conservative
|
| Con |
 |
25,086 |
50.06% |
| Lab |
 |
8,424 |
16.81% |
| LD |
 |
15,721 |
31.37% |
| Ref |
|
0 |
0.00% |
| Oth |
 |
877 |
1.75% |
| Maj |
 |
9,365 |
18.69% |
| Turn |
 |
50,108 |
75.74% |
|
|
 |
|
Conservative
|
| Con |
 |
32,692 |
61.70% |
| Lab |
 |
5,987 |
11.30% |
| LD |
 |
13,575 |
25.60% |
| Oth |
 |
701 |
1.30% |
| Maj |
 |
19,117 |
36.10% |
| Turn |
 |
52,955 |
80.05% |
|
|
 |
|

|

