|
Blaby
Conservative hold

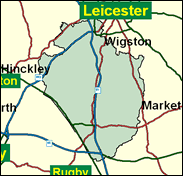
The seat associated from 1974 to 1992 with Mrs Thatcher's Chancellor of the Exchequer Nigel Lawson is one of several centred on the suburbs of Leicester, which is a much bigger place than often credited when its satellites outside the formal boundaries are taken into account. Here are to be found Blaby itself, a number of other suburban areas, and some miles of countryside as far as the small town of Lutterworth. This is everything that the seats within Leicester are not: almost all white, owner occupied, middle class, and safely Tory at all levels, giving Andrew Robathan a 6,000 majority even after the standard double figure swing to Labour in 1997.

Andrew Robathan, born 1951, public school and Oxford (Merchant Taylor's and Oriel) - educated and a former Guards officer, won this seat in 1992. A contributor to the ‘Bearing the Standard' call in 1991 for social cohesion, but with private health,welfare and prisons, he was a Redwood-supporting Eurosceptic, an opponent of the politically correct inclusion of women in combative Army roles, and speaks against homosexual sex at sixteen by evoking Oscar Wilde's penchant for under-aged boys. A cycling environmentalist, he also urges defence of the threatened water vole (‘Ratty' in ‘Wind in the Willows') from its predator, the feral mink.

 |
| Wealthy Achievers, Suburban Areas |
22.79% |
14.99% |
152.03 |
|
| Affluent Greys, Rural Communities |
0.00% |
2.13% |
0.00 |
|
| Prosperous Pensioners, Retirement Areas |
0.05% |
2.49% |
1.91 |
|
| Affluent Executives, Family Areas |
13.34% |
4.43% |
301.53 |
|
| Well-Off Workers, Family Areas |
26.97% |
7.27% |
370.85 |
|
| Affluent Urbanites, Town & City Areas |
0.12% |
2.56% |
4.51 |
|
| Prosperous Professionals, Metropolitan Areas |
0.00% |
2.04% |
0.00 |
|
| Better-Off Executives, Inner City Areas |
0.05% |
3.94% |
1.21 |
|
| Comfortable Middle Agers, Mature Home Owning Areas |
15.06% |
13.04% |
115.47 |
|
| Skilled Workers, Home Owning Areas |
14.44% |
12.70% |
113.69 |
|
| New Home Owners, Mature Communities |
5.76% |
8.14% |
70.69 |
|
| White Collar Workers, Better-Off Multi Ethnic Areas |
0.34% |
4.02% |
8.41 |
|
| Older People, Less Prosperous Areas |
1.06% |
3.19% |
33.15 |
|
| Council Estate Residents, Better-Off Homes |
0.00% |
11.31% |
0.00 |
|
| Council Estate Residents, High Unemployment |
0.03% |
3.06% |
0.92 |
|
| Council Estate Residents, Greatest Hardship |
0.00% |
2.52% |
0.00 |
|
| People in Multi-Ethnic, Low-Income Areas |
0.00% |
2.10% |
0.00 |
|
| Unclassified |
0.00% |
0.06% |
0.00 |
|
|
 |
 |
 |
| £0-5K |
6.27% |
9.41% |
66.65 |
|
| £5-10K |
13.67% |
16.63% |
82.18 |
|
| £10-15K |
15.70% |
16.58% |
94.72 |
|
| £15-20K |
14.13% |
13.58% |
104.04 |
|
| £20-25K |
11.49% |
10.39% |
110.52 |
|
| £25-30K |
8.92% |
7.77% |
114.78 |
|
| £30-35K |
6.80% |
5.79% |
117.37 |
|
| £35-40K |
5.14% |
4.33% |
118.74 |
|
| £40-45K |
3.89% |
3.27% |
119.23 |
|
| £45-50K |
2.96% |
2.48% |
119.10 |
|
| £50-55K |
2.26% |
1.90% |
118.54 |
|
| £55-60K |
1.74% |
1.47% |
117.68 |
|
| £60-65K |
1.34% |
1.15% |
116.64 |
|
| £65-70K |
1.05% |
0.91% |
115.48 |
|
| £70-75K |
0.82% |
0.72% |
114.26 |
|
| £75-80K |
0.65% |
0.57% |
113.01 |
|
| £80-85K |
0.52% |
0.46% |
111.76 |
|
| £85-90K |
0.41% |
0.37% |
110.52 |
|
| £90-95K |
0.33% |
0.31% |
109.33 |
|
| £95-100K |
0.27% |
0.25% |
108.17 |
|
| £100K + |
1.37% |
1.34% |
102.03 |
|
|
|

|


|
1992-1997
|
1997-2001
|
|
|
|
| Con |
-10.97% |
| Lab |
11.95% |
| LD |
-5.17% |
|
| Con |
0.56% |
| Lab |
-0.39% |
| LD |
2.46% |
|
|
 |
Andrew Robathan
Conservative hold
|
| Con |
 |
22,104 |
46.40% |
| Lab |
 |
15,895 |
33.36% |
| LD |
 |
8,286 |
17.39% |
| Oth |
 |
1,357 |
2.85% |
| Maj |
 |
6,209 |
13.03% |
| Turn |
 |
47,642 |
64.46% |
|
|
 |
Andrew Robathan
Conservative hold
|
| L |
David Morgan |
15,895 |
33.36% |
| C |
Andrew Robathan |
22,104 |
46.40% |
| BNP |
Edward Scott |
1,357 |
2.85% |
| LD |
Geoff Welsh |
8,286 |
17.39% |
|
Candidates representing 4 parties stood for election to this seat.
|
|
 |
Andrew Robathan
Conservative
|
| Con |
 |
24,564 |
45.83% |
| Lab |
 |
18,090 |
33.75% |
| LD |
 |
8,001 |
14.93% |
| Ref |
 |
2,018 |
3.77% |
| Oth |
 |
920 |
1.72% |
| Maj |
 |
6,474 |
12.08% |
| Turn |
 |
53,593 |
76.05% |
|
|
 |
|
Conservative
|
| Con |
 |
31,882 |
56.80% |
| Lab |
 |
12,213 |
21.80% |
| LD |
 |
11,261 |
20.10% |
| Oth |
 |
781 |
1.40% |
| Maj |
 |
19,669 |
35.00% |
| Turn |
 |
56,137 |
83.49% |
|
|
 |
|

|

