|
Wolverhampton South West
Labour hold

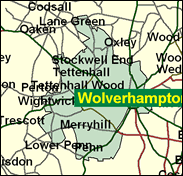
When the rather unglamorous West Midlands borough of Wolverhampton was elevated to the status of city in honour of the Millennium in December 2000 (along with Inverness and Brighton/Hove) Labour were accused of playing party politics in the distribution of honours. Since the other two constituencies in Wolverhampton are safely Labour already, it must have been South West that the critics had in mind. This is the former seat of the late Enoch Powell, although that dark soul left voluntarily in 1974. It did not fall, however, until 1997, when Nicholas Budgen (an independently minded politician who has also now departed this life) was beaten by Jenny Jones, a very different New Labour figure. The margin was 10.5pc, slightly less than Labour's national lead, and the swing also very slightly less than average. The Tories can indeed hope to win the seat again one day - it is not in fact moving away from them on a long-term basis, say because of demographics, as in many metropolitan areas like Liverpool and Manchester, nor has their local base been destroyed, as the most recent local elections here show: the Conservative candidates were over 20pc ahead of Labour in the wards within SW, and they have a solid middle class bloc on the edge of the city and the conurbation at Penn and Tettenhall. City or no city, a battle royal of great passion and significance may be expected in this corner of Wolverhampton at the next general election.

Rob Marris, selected in place of the one-term retiring Labour MP Jenny Jones, is a solicitor, born 1955, educated at St Edward's School, Oxford, and at the University of British Columbia and Birmingham Polytechnic. As a student in Canada he worked as a bus driver and trucker. He is a member of Greenpeace and describes himself as "well-versed in matters Canadian", which should help when confronting the problem of the lumbering industry in Wolverhampton.
 |
| Wealthy Achievers, Suburban Areas |
23.03% |
14.99% |
153.60 |
|
| Affluent Greys, Rural Communities |
0.00% |
2.13% |
0.00 |
|
| Prosperous Pensioners, Retirement Areas |
2.09% |
2.49% |
84.26 |
|
| Affluent Executives, Family Areas |
0.25% |
4.43% |
5.55 |
|
| Well-Off Workers, Family Areas |
2.26% |
7.27% |
31.10 |
|
| Affluent Urbanites, Town & City Areas |
2.32% |
2.56% |
90.60 |
|
| Prosperous Professionals, Metropolitan Areas |
1.26% |
2.04% |
61.85 |
|
| Better-Off Executives, Inner City Areas |
3.70% |
3.94% |
93.81 |
|
| Comfortable Middle Agers, Mature Home Owning Areas |
16.56% |
13.04% |
126.99 |
|
| Skilled Workers, Home Owning Areas |
2.92% |
12.70% |
22.98 |
|
| New Home Owners, Mature Communities |
6.91% |
8.14% |
84.91 |
|
| White Collar Workers, Better-Off Multi Ethnic Areas |
3.81% |
4.02% |
94.71 |
|
| Older People, Less Prosperous Areas |
2.47% |
3.19% |
77.51 |
|
| Council Estate Residents, Better-Off Homes |
16.72% |
11.31% |
147.86 |
|
| Council Estate Residents, High Unemployment |
4.24% |
3.06% |
138.57 |
|
| Council Estate Residents, Greatest Hardship |
3.78% |
2.52% |
150.15 |
|
| People in Multi-Ethnic, Low-Income Areas |
7.64% |
2.10% |
363.77 |
|
| Unclassified |
0.03% |
0.06% |
40.13 |
|
|
 |
 |
 |
| £0-5K |
11.84% |
9.41% |
125.80 |
|
| £5-10K |
17.89% |
16.63% |
107.57 |
|
| £10-15K |
16.66% |
16.58% |
100.48 |
|
| £15-20K |
13.16% |
13.58% |
96.92 |
|
| £20-25K |
9.87% |
10.39% |
94.94 |
|
| £25-30K |
7.29% |
7.77% |
93.75 |
|
| £30-35K |
5.38% |
5.79% |
92.95 |
|
| £35-40K |
4.00% |
4.33% |
92.37 |
|
| £40-45K |
3.00% |
3.27% |
91.90 |
|
| £45-50K |
2.27% |
2.48% |
91.50 |
|
| £50-55K |
1.74% |
1.90% |
91.14 |
|
| £55-60K |
1.34% |
1.47% |
90.81 |
|
| £60-65K |
1.04% |
1.15% |
90.49 |
|
| £65-70K |
0.82% |
0.91% |
90.18 |
|
| £70-75K |
0.65% |
0.72% |
89.88 |
|
| £75-80K |
0.52% |
0.57% |
89.60 |
|
| £80-85K |
0.41% |
0.46% |
89.32 |
|
| £85-90K |
0.33% |
0.37% |
89.05 |
|
| £90-95K |
0.27% |
0.31% |
88.78 |
|
| £95-100K |
0.22% |
0.25% |
88.52 |
|
| £100K + |
1.17% |
1.34% |
86.89 |
|
|
|

|


|
1992-1997
|
1997-2001
|
|
|
|
| Con |
-9.36% |
| Lab |
10.50% |
| LD |
-0.30% |
|
| Con |
-0.21% |
| Lab |
-2.15% |
| LD |
0.17% |
|
|
 |
Robert Marris
Labour hold
|
| Con |
 |
16,248 |
39.73% |
| Lab |
 |
19,735 |
48.26% |
| LD |
 |
3,425 |
8.37% |
| Oth |
 |
1,489 |
3.64% |
| Maj |
 |
3,487 |
8.53% |
| Turn |
 |
40,897 |
60.88% |
|
|
 |
Robert Marris
Labour hold
|
| C |
David Chambers |
16,248 |
39.73% |
| LD |
Mike Dixon |
3,425 |
8.37% |
| UK |
Doug Hope |
684 |
1.67% |
| L |
Robert Marris |
19,735 |
48.26% |
| G |
Wendy Walker |
805 |
1.97% |
|
Candidates representing 5 parties stood for election to this seat.
|
|
 |
Jenny Jones
Labour gain
|
| Con |
 |
19,539 |
39.94% |
| Lab |
 |
24,657 |
50.40% |
| LD |
 |
4,012 |
8.20% |
| Ref |
|
0 |
0.00% |
| Oth |
 |
713 |
1.46% |
| Maj |
 |
5,118 |
10.46% |
| Turn |
 |
48,921 |
72.49% |
|
|
 |
|
Conservative
|
| Con |
 |
25,969 |
49.30% |
| Lab |
 |
21,003 |
39.90% |
| LD |
 |
4,470 |
8.50% |
| Oth |
 |
1,237 |
2.30% |
| Maj |
 |
4,966 |
9.40% |
| Turn |
 |
52,679 |
77.25% |
|
|
 |
|

|

