|
Woodspring
Conservative hold

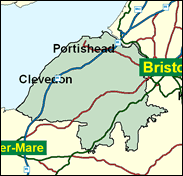
One West Country seat which was not even seriously threatened by the Liberal Democrats in 1997 was Woodspring, formerly in Somerset, then in Avon, and now in North Somerset unitary authority. This seat includes Clevedon, Nailsea, Portishead and the Gordano valley, all of which are regarded as desirable residential areas within striking distance of Bristol, reaching almost to the Clifton suspension bridge. This is an extension of the fashionable side of the city. This is not a truly rural seat, and has far more suburban characteristics. It is the safest Tory seat for several dozen miles in any direction. Labour, far from being squeezed, increased their share in 1997; local elections suggest that their greatest strength is in the largest town, Clevedon. There is of course no town called Woodspring, and the name is in line to be abolished in the next boundary review, and a Somerset North seat will re-appear; but that will not happen for at least two and maybe three more elections. Dr Liam Fox must be the favourite to see Woodspring's life out.

Dr Liam Fox, Shadow Health Secretary, is a Scottish-born (1961) GP, educated at St Bride's (RC) High School, East Kilbride and Glasgow University, who relocated to England after losing at Roxburgh & Berwickshire in 1987, and won Woodspring in 1992. A self-confessed child of Thatcher, because "Thatcherism is the only Conservatism that people of my age have ever known", he voted for Howard in 1997 and as an ex-pat Scot was given the job of opposing Scottish devolution from the safety of the Bristol green belt. His Catholicism is reflected in his intemperate call in January 2001 for "huge restriction, if not abolition, of the current abortion law."
 |
| Wealthy Achievers, Suburban Areas |
44.16% |
14.99% |
294.50 |
|
| Affluent Greys, Rural Communities |
0.00% |
2.13% |
0.00 |
|
| Prosperous Pensioners, Retirement Areas |
2.18% |
2.49% |
87.54 |
|
| Affluent Executives, Family Areas |
9.73% |
4.43% |
219.99 |
|
| Well-Off Workers, Family Areas |
10.41% |
7.27% |
143.07 |
|
| Affluent Urbanites, Town & City Areas |
1.65% |
2.56% |
64.25 |
|
| Prosperous Professionals, Metropolitan Areas |
0.05% |
2.04% |
2.36 |
|
| Better-Off Executives, Inner City Areas |
0.00% |
3.94% |
0.00 |
|
| Comfortable Middle Agers, Mature Home Owning Areas |
22.50% |
13.04% |
172.57 |
|
| Skilled Workers, Home Owning Areas |
2.07% |
12.70% |
16.27 |
|
| New Home Owners, Mature Communities |
4.74% |
8.14% |
58.25 |
|
| White Collar Workers, Better-Off Multi Ethnic Areas |
0.42% |
4.02% |
10.47 |
|
| Older People, Less Prosperous Areas |
0.78% |
3.19% |
24.45 |
|
| Council Estate Residents, Better-Off Homes |
1.23% |
11.31% |
10.88 |
|
| Council Estate Residents, High Unemployment |
0.09% |
3.06% |
2.87 |
|
| Council Estate Residents, Greatest Hardship |
0.00% |
2.52% |
0.00 |
|
| People in Multi-Ethnic, Low-Income Areas |
0.00% |
2.10% |
0.00 |
|
| Unclassified |
0.00% |
0.06% |
0.00 |
|
|
 |
 |
 |
| £0-5K |
6.12% |
9.41% |
65.05 |
|
| £5-10K |
12.49% |
16.63% |
75.08 |
|
| £10-15K |
14.29% |
16.58% |
86.19 |
|
| £15-20K |
13.10% |
13.58% |
96.41 |
|
| £20-25K |
10.94% |
10.39% |
105.24 |
|
| £25-30K |
8.76% |
7.77% |
112.68 |
|
| £30-35K |
6.89% |
5.79% |
118.87 |
|
| £35-40K |
5.37% |
4.33% |
124.01 |
|
| £40-45K |
4.19% |
3.27% |
128.25 |
|
| £45-50K |
3.27% |
2.48% |
131.76 |
|
| £50-55K |
2.56% |
1.90% |
134.67 |
|
| £55-60K |
2.02% |
1.47% |
137.08 |
|
| £60-65K |
1.60% |
1.15% |
139.09 |
|
| £65-70K |
1.28% |
0.91% |
140.76 |
|
| £70-75K |
1.02% |
0.72% |
142.17 |
|
| £75-80K |
0.82% |
0.57% |
143.34 |
|
| £80-85K |
0.67% |
0.46% |
144.33 |
|
| £85-90K |
0.54% |
0.37% |
145.16 |
|
| £90-95K |
0.45% |
0.31% |
145.87 |
|
| £95-100K |
0.37% |
0.25% |
146.46 |
|
| £100K + |
1.99% |
1.34% |
148.38 |
|
|
|

|


|
1992-1997
|
1997-2001
|
|
|
|
| Con |
-8.83% |
| Lab |
8.31% |
| LD |
-1.31% |
|
| Con |
-0.79% |
| Lab |
4.92% |
| LD |
-6.15% |
|
|
 |
Liam Fox
Conservative hold
|
| Con |
 |
21,297 |
43.68% |
| Lab |
 |
12,499 |
25.63% |
| LD |
 |
11,816 |
24.23% |
| Oth |
 |
3,146 |
6.45% |
| Maj |
 |
8,798 |
18.04% |
| Turn |
 |
48,758 |
68.65% |
|
|
 |
Liam Fox
Conservative hold
|
| UK |
Fraser Crean |
452 |
0.93% |
| LD |
Colin Eldridge |
11,816 |
24.23% |
| C |
Liam Fox |
21,297 |
43.68% |
| G |
Richard Lawson |
1,282 |
2.63% |
| I |
David Shopland |
1,412 |
2.90% |
| L |
Chanel Stevens |
12,499 |
25.63% |
|
Candidates representing 6 parties stood for election to this seat.
|
|
 |
Liam Fox
Conservative
|
| Con |
 |
24,425 |
44.47% |
| Lab |
 |
11,377 |
20.71% |
| LD |
 |
16,691 |
30.39% |
| Ref |
 |
1,614 |
2.94% |
| Oth |
 |
820 |
1.49% |
| Maj |
 |
7,734 |
14.08% |
| Turn |
 |
54,927 |
78.51% |
|
|
 |
|
Conservative
|
| Con |
 |
29,529 |
53.30% |
| Lab |
 |
6,863 |
12.40% |
| LD |
 |
17,523 |
31.70% |
| Oth |
 |
1,445 |
2.60% |
| Maj |
 |
12,006 |
21.70% |
| Turn |
 |
55,360 |
80.52% |
|
|
 |
|

|

