|
Worcester
Labour hold

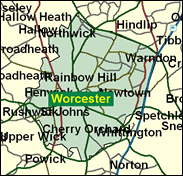
First won by Labour in 1997, despite its famous historical battles between Parliamentarians and Royalists, after boundary changes which came into effect that year and which removed Tory-inclined villages leaving an urban core, Worcester is now a bellwether seat. Whichever party wins Worcester will win the general election. Perhaps that is one reason why the myth of the critical swing voter "Worcester Woman" was invented. Of course this implies targeting run mad. Important as the females of Worcester are, they no more speak for the rest of the country - or each other - than those other creations of dreaming marketing executives, Essex Man and the C2s. The Tories were 14pc behind Michael Foster MP in 1997, but 15.6pc ahead of Labour candidates in May 2000 city elections. The turnout in the former was just under 75pc; in the latter just over 30pc - and the government of the country was not at stake. These figures cannot be broken down by gender. Worcester man as well as woman can be fickle and exercise the right to change mind on a matter. Foster hopes that both sexes won't; Conservative Richard Adams that they will.

Michael Foster, victor for Labour here in 1997, is a very tall, standard on-message loyalist recruited from the chalk-face (as an accountancy lecturer). Born in 1963, he attended Great Wyrley High School, Walsall, Wolverhampton Poly, and the University of Central England. He is defined by his, albeit fleetingly articulated, assault on fox hunting, which set the ball rolling for the permanent booting-around of an issue seen by the focus group analysts as a good mobiliser of populist urban sentiment against the toff-sodden shires.
 |
| Wealthy Achievers, Suburban Areas |
10.37% |
14.99% |
69.19 |
|
| Affluent Greys, Rural Communities |
0.00% |
2.13% |
0.00 |
|
| Prosperous Pensioners, Retirement Areas |
1.05% |
2.49% |
42.19 |
|
| Affluent Executives, Family Areas |
13.06% |
4.43% |
295.09 |
|
| Well-Off Workers, Family Areas |
8.99% |
7.27% |
123.58 |
|
| Affluent Urbanites, Town & City Areas |
0.69% |
2.56% |
26.75 |
|
| Prosperous Professionals, Metropolitan Areas |
0.16% |
2.04% |
8.00 |
|
| Better-Off Executives, Inner City Areas |
2.27% |
3.94% |
57.64 |
|
| Comfortable Middle Agers, Mature Home Owning Areas |
17.21% |
13.04% |
132.00 |
|
| Skilled Workers, Home Owning Areas |
13.17% |
12.70% |
103.69 |
|
| New Home Owners, Mature Communities |
5.68% |
8.14% |
69.73 |
|
| White Collar Workers, Better-Off Multi Ethnic Areas |
10.21% |
4.02% |
253.86 |
|
| Older People, Less Prosperous Areas |
1.95% |
3.19% |
61.28 |
|
| Council Estate Residents, Better-Off Homes |
11.12% |
11.31% |
98.30 |
|
| Council Estate Residents, High Unemployment |
2.34% |
3.06% |
76.40 |
|
| Council Estate Residents, Greatest Hardship |
1.73% |
2.52% |
68.60 |
|
| People in Multi-Ethnic, Low-Income Areas |
0.00% |
2.10% |
0.00 |
|
| Unclassified |
0.00% |
0.06% |
0.00 |
|
|
 |
 |
 |
| £0-5K |
9.12% |
9.41% |
96.86 |
|
| £5-10K |
17.06% |
16.63% |
102.59 |
|
| £10-15K |
17.40% |
16.58% |
104.95 |
|
| £15-20K |
14.37% |
13.58% |
105.77 |
|
| £20-25K |
10.96% |
10.39% |
105.42 |
|
| £25-30K |
8.09% |
7.77% |
104.07 |
|
| £30-35K |
5.90% |
5.79% |
101.94 |
|
| £35-40K |
4.30% |
4.33% |
99.24 |
|
| £40-45K |
3.14% |
3.27% |
96.15 |
|
| £45-50K |
2.30% |
2.48% |
92.84 |
|
| £50-55K |
1.70% |
1.90% |
89.42 |
|
| £55-60K |
1.27% |
1.47% |
85.99 |
|
| £60-65K |
0.95% |
1.15% |
82.61 |
|
| £65-70K |
0.72% |
0.91% |
79.32 |
|
| £70-75K |
0.55% |
0.72% |
76.15 |
|
| £75-80K |
0.42% |
0.57% |
73.13 |
|
| £80-85K |
0.32% |
0.46% |
70.25 |
|
| £85-90K |
0.25% |
0.37% |
67.53 |
|
| £90-95K |
0.20% |
0.31% |
64.95 |
|
| £95-100K |
0.16% |
0.25% |
62.52 |
|
| £100K + |
0.68% |
1.34% |
50.50 |
|
|
|

|


|
1992-1997
|
1997-2001
|
|
|
|
| Con |
-9.81% |
| Lab |
10.17% |
| LD |
-0.58% |
|
| Con |
-0.15% |
| Lab |
-1.49% |
| LD |
0.10% |
|
|
 |
Michael Foster
Labour hold
|
| Con |
 |
15,712 |
35.54% |
| Lab |
 |
21,478 |
48.58% |
| LD |
 |
5,578 |
12.62% |
| Oth |
 |
1,442 |
3.26% |
| Maj |
 |
5,766 |
13.04% |
| Turn |
 |
44,210 |
62.07% |
|
|
 |
Michael Foster
Labour hold
|
| C |
Richard Adams |
15,712 |
35.54% |
| UK |
Richard Chamings |
1,442 |
3.26% |
| LD |
Paul Chandler |
5,578 |
12.62% |
| L |
Michael Foster |
21,478 |
48.58% |
|
Candidates representing 4 parties stood for election to this seat.
|
|
 |
Michael Foster
Labour gain
|
| Con |
 |
18,423 |
35.69% |
| Lab |
 |
25,848 |
50.07% |
| LD |
 |
6,462 |
12.52% |
| Ref |
|
0 |
0.00% |
| Oth |
 |
886 |
1.72% |
| Maj |
 |
7,425 |
14.38% |
| Turn |
 |
51,619 |
74.56% |
|
|
 |
|
Conservative
|
| Con |
 |
23,960 |
45.50% |
| Lab |
 |
21,013 |
39.90% |
| LD |
 |
6,890 |
13.10% |
| Oth |
 |
823 |
1.60% |
| Maj |
 |
2,947 |
5.60% |
| Turn |
 |
52,686 |
82.81% |
|
|
 |
|

|

