|
Worcestershire Mid
Conservative hold

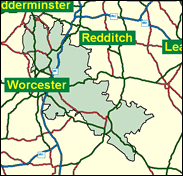
This is not to be confused with a seat of the same name which existed before the 1997 boundary changes, and formed the basis of the constituency won by Labour then based on Redditch. This is a new and extra division created as a result of the population increase in the county, including the towns of Droitwich and Evesham and many euphonious villages like Upton Snodsbury and Drakes Broughton. Peter Luff, the former Worcester MP, cannily followed the rural minority out of that seat and into this one. This tactic bore fruit, as he won easily. Labour finished second; their strength lies solely in the towns, while Luff's is spread more widely to good effect.

Peter Luff, a Whip, as MP for Worcester 1992-97, wisely migrated here to evade the high Labour tide of 1997. A PR man with additional interests in his family's printing business, he is a protégé of Peter Walker, from whom he inherited the Worcester seat in 1992. A Tory Reform Group Europhile, he nonetheless rejects the other half of the Euro-federalists' agenda, namely the break-up of the old nation states via regional devolution. Born 1955 and educated at Windsor Grammar School and Corpus Christi College, Cambridge, he has latterly emerged as the Tory part of the three-party trio (the others being Labour's Kate Hoey and the Liberals' Lembit Opik) proposing a "middle way" to restrict but not ban hunting.
 |
| Wealthy Achievers, Suburban Areas |
32.45% |
14.99% |
216.44 |
|
| Affluent Greys, Rural Communities |
2.15% |
2.13% |
101.20 |
|
| Prosperous Pensioners, Retirement Areas |
1.85% |
2.49% |
74.46 |
|
| Affluent Executives, Family Areas |
9.23% |
4.43% |
208.56 |
|
| Well-Off Workers, Family Areas |
6.83% |
7.27% |
93.85 |
|
| Affluent Urbanites, Town & City Areas |
0.37% |
2.56% |
14.39 |
|
| Prosperous Professionals, Metropolitan Areas |
0.00% |
2.04% |
0.00 |
|
| Better-Off Executives, Inner City Areas |
0.23% |
3.94% |
5.75 |
|
| Comfortable Middle Agers, Mature Home Owning Areas |
18.29% |
13.04% |
140.27 |
|
| Skilled Workers, Home Owning Areas |
8.51% |
12.70% |
66.99 |
|
| New Home Owners, Mature Communities |
8.80% |
8.14% |
108.13 |
|
| White Collar Workers, Better-Off Multi Ethnic Areas |
1.60% |
4.02% |
39.85 |
|
| Older People, Less Prosperous Areas |
3.38% |
3.19% |
106.01 |
|
| Council Estate Residents, Better-Off Homes |
6.18% |
11.31% |
54.60 |
|
| Council Estate Residents, High Unemployment |
0.07% |
3.06% |
2.20 |
|
| Council Estate Residents, Greatest Hardship |
0.07% |
2.52% |
2.63 |
|
| People in Multi-Ethnic, Low-Income Areas |
0.00% |
2.10% |
0.00 |
|
| Unclassified |
0.00% |
0.06% |
0.00 |
|
|
 |
 |
 |
| £0-5K |
7.77% |
9.41% |
82.49 |
|
| £5-10K |
14.35% |
16.63% |
86.27 |
|
| £10-15K |
15.34% |
16.58% |
92.52 |
|
| £15-20K |
13.37% |
13.58% |
98.45 |
|
| £20-25K |
10.76% |
10.39% |
103.54 |
|
| £25-30K |
8.38% |
7.77% |
107.78 |
|
| £30-35K |
6.44% |
5.79% |
111.25 |
|
| £35-40K |
4.94% |
4.33% |
114.09 |
|
| £40-45K |
3.80% |
3.27% |
116.41 |
|
| £45-50K |
2.94% |
2.48% |
118.30 |
|
| £50-55K |
2.28% |
1.90% |
119.84 |
|
| £55-60K |
1.79% |
1.47% |
121.12 |
|
| £60-65K |
1.41% |
1.15% |
122.16 |
|
| £65-70K |
1.12% |
0.91% |
123.03 |
|
| £70-75K |
0.89% |
0.72% |
123.75 |
|
| £75-80K |
0.71% |
0.57% |
124.36 |
|
| £80-85K |
0.58% |
0.46% |
124.86 |
|
| £85-90K |
0.47% |
0.37% |
125.29 |
|
| £90-95K |
0.38% |
0.31% |
125.66 |
|
| £95-100K |
0.31% |
0.25% |
125.97 |
|
| £100K + |
1.71% |
1.34% |
127.01 |
|
|
|

|


|
1992-1997
|
1997-2001
|
|
|
|
| Con |
-7.49% |
| Lab |
11.29% |
| LD |
-7.49% |
|
| Con |
3.68% |
| Lab |
-1.47% |
| LD |
0.14% |
|
|
 |
Peter Luff
Conservative hold
|
| Con |
 |
22,937 |
51.09% |
| Lab |
 |
12,310 |
27.42% |
| LD |
 |
8,420 |
18.75% |
| Oth |
 |
1,230 |
2.74% |
| Maj |
 |
10,627 |
23.67% |
| Turn |
 |
44,897 |
62.37% |
|
|
 |
Peter Luff
Conservative hold
|
| L |
David Bannister |
12,310 |
27.42% |
| UK |
Tony Eaves |
1,230 |
2.74% |
| C |
Peter Luff |
22,937 |
51.09% |
| LD |
Robert Woodthorpe-Browne |
8,420 |
18.75% |
|
Candidates representing 4 parties stood for election to this seat.
|
|
 |
Peter Luff
Conservative
|
| Con |
 |
24,092 |
47.41% |
| Lab |
 |
14,680 |
28.89% |
| LD |
 |
9,458 |
18.61% |
| Ref |
 |
1,780 |
3.50% |
| Oth |
 |
809 |
1.59% |
| Maj |
 |
9,412 |
18.52% |
| Turn |
 |
50,819 |
74.32% |
|
|
 |
|
Conservative
|
| Con |
 |
27,535 |
54.90% |
| Lab |
 |
8,832 |
17.60% |
| LD |
 |
13,081 |
26.10% |
| Oth |
 |
663 |
1.30% |
| Maj |
 |
14,454 |
28.80% |
| Turn |
 |
50,111 |
78.80% |
|
|
 |
|

|

