|
Workington
Labour hold

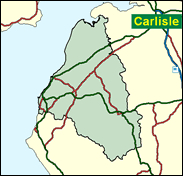
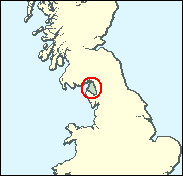
Workington has long been the safest of Labour's four seats in Cumbria - indeed it was actually one of the 50 or so which survived the biggest disaster of all in 1931, but it was once lost, just for three years after a by-election in 1976, one of the last actually lost by an incumbent Labour government. At first sight it seems an odd place to have this odd history, for it includes a considerable part of the Lake District National Park, including Keswick at the very heart of the lakes, and Derwentwater, Buttermere and Crummock Water. But this area is outvoted by the traditionally working class industrial and often depressed west Cumberland coastal strip, with the bleak steel town of Workington itself and Maryport, whose docks fell into decay in the 1960s and 1970s before being revivified and spruced up to effect in more recent years. Dale Campbell Savours has built up the majority to its present level of 19,000, which ensures that it can be passed on to a new Labour MP; there are county council electoral districts where Labour are returned unopposed. This is one of the very weakest areas in the whole country for the Liberal Democrats.

Alongside Jack Cunningham in next-door Copeland, Labour have picked Tony Cunningham as replacement for the retiring Dale Campbell-Savours. A local boy, born 1952 and educated at Workington Grammar School and Liverpool University, he was a teacher for 18 years, did five years as an MEP and latterly has run a human rights organisation. A Labour spokesman on third world issues in the European Parliament, he wrote a report on landmines in 1995, was leader of Allerdale Borough Council from 1992 to 94, and Mayor of Workington in 1990-91.
 |
| Wealthy Achievers, Suburban Areas |
7.12% |
14.99% |
47.48 |
|
| Affluent Greys, Rural Communities |
10.34% |
2.13% |
486.49 |
|
| Prosperous Pensioners, Retirement Areas |
2.04% |
2.49% |
81.89 |
|
| Affluent Executives, Family Areas |
1.16% |
4.43% |
26.17 |
|
| Well-Off Workers, Family Areas |
7.73% |
7.27% |
106.25 |
|
| Affluent Urbanites, Town & City Areas |
0.14% |
2.56% |
5.30 |
|
| Prosperous Professionals, Metropolitan Areas |
0.00% |
2.04% |
0.00 |
|
| Better-Off Executives, Inner City Areas |
0.07% |
3.94% |
1.81 |
|
| Comfortable Middle Agers, Mature Home Owning Areas |
14.29% |
13.04% |
109.56 |
|
| Skilled Workers, Home Owning Areas |
22.87% |
12.70% |
180.06 |
|
| New Home Owners, Mature Communities |
11.27% |
8.14% |
138.41 |
|
| White Collar Workers, Better-Off Multi Ethnic Areas |
2.12% |
4.02% |
52.79 |
|
| Older People, Less Prosperous Areas |
2.88% |
3.19% |
90.32 |
|
| Council Estate Residents, Better-Off Homes |
15.78% |
11.31% |
139.48 |
|
| Council Estate Residents, High Unemployment |
0.81% |
3.06% |
26.30 |
|
| Council Estate Residents, Greatest Hardship |
1.26% |
2.52% |
49.86 |
|
| People in Multi-Ethnic, Low-Income Areas |
0.00% |
2.10% |
0.00 |
|
| Unclassified |
0.14% |
0.06% |
225.49 |
|
|
 |
 |
 |
| £0-5K |
10.69% |
9.41% |
113.53 |
|
| £5-10K |
19.43% |
16.63% |
116.81 |
|
| £10-15K |
18.68% |
16.58% |
112.69 |
|
| £15-20K |
14.50% |
13.58% |
106.76 |
|
| £20-25K |
10.45% |
10.39% |
100.51 |
|
| £25-30K |
7.35% |
7.77% |
94.48 |
|
| £30-35K |
5.15% |
5.79% |
88.88 |
|
| £35-40K |
3.63% |
4.33% |
83.75 |
|
| £40-45K |
2.58% |
3.27% |
79.09 |
|
| £45-50K |
1.86% |
2.48% |
74.85 |
|
| £50-55K |
1.35% |
1.90% |
70.99 |
|
| £55-60K |
0.99% |
1.47% |
67.49 |
|
| £60-65K |
0.74% |
1.15% |
64.29 |
|
| £65-70K |
0.56% |
0.91% |
61.36 |
|
| £70-75K |
0.42% |
0.72% |
58.68 |
|
| £75-80K |
0.32% |
0.57% |
56.22 |
|
| £80-85K |
0.25% |
0.46% |
53.95 |
|
| £85-90K |
0.19% |
0.37% |
51.86 |
|
| £90-95K |
0.15% |
0.31% |
49.92 |
|
| £95-100K |
0.12% |
0.25% |
48.12 |
|
| £100K + |
0.53% |
1.34% |
39.43 |
|
|
|

|


|
1992-1997
|
1997-2001
|
|
|
|
| Con |
-11.97% |
| Lab |
10.04% |
| LD |
0.53% |
|
| Con |
5.12% |
| Lab |
-8.74% |
| LD |
4.43% |
|
|
 |
Tony Cunningham
Labour hold
|
| Con |
 |
12,359 |
29.55% |
| Lab |
 |
23,209 |
55.49% |
| LD |
 |
5,214 |
12.47% |
| Oth |
 |
1,040 |
2.49% |
| Maj |
 |
10,850 |
25.94% |
| Turn |
 |
41,822 |
63.40% |
|
|
 |
Tony Cunningham
Labour hold
|
| L |
Tony Cunningham |
23,209 |
55.49% |
| LD |
Ian Francis |
5,214 |
12.47% |
| LCA |
John Peacock |
1,040 |
2.49% |
| C |
Tim Stoddart |
12,359 |
29.55% |
|
Candidates representing 4 parties stood for election to this seat.
|
|
 |
Dale Campbell-Savour
Labour
|
| Con |
 |
12,061 |
24.43% |
| Lab |
 |
31,717 |
64.24% |
| LD |
 |
3,967 |
8.03% |
| Ref |
 |
1,412 |
2.86% |
| Oth |
 |
217 |
0.44% |
| Maj |
 |
19,656 |
39.81% |
| Turn |
 |
49,374 |
75.08% |
|
|
 |
|
Labour
|
| Con |
 |
19,696 |
36.40% |
| Lab |
 |
29,296 |
54.20% |
| LD |
 |
4,028 |
7.50% |
| Oth |
 |
1,018 |
1.90% |
| Maj |
 |
9,600 |
17.80% |
| Turn |
 |
54,038 |
80.82% |
|
|
 |
|

|

