|
Worthing East & Shoreham
Conservative hold

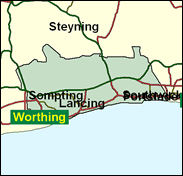
This West Sussex seat, created in 1997, contains only the four easternmost wards of Worthing, a seaside resort known for its flat and featureless front and its high proportion of pensioners. The bulk of the population and electorate (over 46,000 in 1997) is made up of the local government district of Adur, first in the alphabet of English local government. Adur includes Shoreham with its large working harbour, and Southwick, both on the way to Hove and Brighton, and Lancing just behind the coast. It has been a strong area for the Liberal Democrats for many years, and even in 1997 in the county council elections which took place on the same day as the general election they more or less tied with the Conservatives in total vote, and yet long term (1986-95) council leader Martin King was 10pc behind the Tory victor Tim Loughton. This cannot be accounted for just by the four Worthing wards, half of which were won by the Lib Dems anyway when last fought (May 2000). The voters here must split their ticket, genuinely believing that their interests are best represented by supporting the LDs at local government level, and the Tories in national contests. Perhaps there are subscribers to the theory of the wasted vote.

Tim Loughton, an Environment spokesman, was elected in 1997. A right-wing partisan pursuer of Geoffrey Robinson and critic of Labour's treatment of General Pinochet, he was born 1962, educated at Priory School, Lewes, Warwick University and Clare College, Cambridge. He worked for Fleming Asset Management, and boasts a record of vocal opposition to a single currency. He scored an own goal in March this year with an injudicious headlined reference to William Hague as a "baldy with a funny accent".
 |
| Wealthy Achievers, Suburban Areas |
14.12% |
14.99% |
94.14 |
|
| Affluent Greys, Rural Communities |
0.00% |
2.13% |
0.00 |
|
| Prosperous Pensioners, Retirement Areas |
9.10% |
2.49% |
366.06 |
|
| Affluent Executives, Family Areas |
0.50% |
4.43% |
11.40 |
|
| Well-Off Workers, Family Areas |
3.67% |
7.27% |
50.42 |
|
| Affluent Urbanites, Town & City Areas |
0.30% |
2.56% |
11.60 |
|
| Prosperous Professionals, Metropolitan Areas |
0.48% |
2.04% |
23.43 |
|
| Better-Off Executives, Inner City Areas |
3.09% |
3.94% |
78.47 |
|
| Comfortable Middle Agers, Mature Home Owning Areas |
23.55% |
13.04% |
180.59 |
|
| Skilled Workers, Home Owning Areas |
14.40% |
12.70% |
113.34 |
|
| New Home Owners, Mature Communities |
16.27% |
8.14% |
199.78 |
|
| White Collar Workers, Better-Off Multi Ethnic Areas |
4.75% |
4.02% |
118.07 |
|
| Older People, Less Prosperous Areas |
5.23% |
3.19% |
164.14 |
|
| Council Estate Residents, Better-Off Homes |
3.59% |
11.31% |
31.70 |
|
| Council Estate Residents, High Unemployment |
0.56% |
3.06% |
18.28 |
|
| Council Estate Residents, Greatest Hardship |
0.18% |
2.52% |
7.14 |
|
| People in Multi-Ethnic, Low-Income Areas |
0.00% |
2.10% |
0.00 |
|
| Unclassified |
0.23% |
0.06% |
363.44 |
|
|
 |
 |
 |
| £0-5K |
8.86% |
9.41% |
94.14 |
|
| £5-10K |
16.71% |
16.63% |
100.45 |
|
| £10-15K |
17.17% |
16.58% |
103.59 |
|
| £15-20K |
14.23% |
13.58% |
104.74 |
|
| £20-25K |
10.87% |
10.39% |
104.58 |
|
| £25-30K |
8.05% |
7.77% |
103.60 |
|
| £30-35K |
5.91% |
5.79% |
102.10 |
|
| £35-40K |
4.35% |
4.33% |
100.29 |
|
| £40-45K |
3.21% |
3.27% |
98.33 |
|
| £45-50K |
2.39% |
2.48% |
96.28 |
|
| £50-55K |
1.79% |
1.90% |
94.23 |
|
| £55-60K |
1.36% |
1.47% |
92.20 |
|
| £60-65K |
1.04% |
1.15% |
90.22 |
|
| £65-70K |
0.80% |
0.91% |
88.31 |
|
| £70-75K |
0.62% |
0.72% |
86.48 |
|
| £75-80K |
0.49% |
0.57% |
84.72 |
|
| £80-85K |
0.38% |
0.46% |
83.05 |
|
| £85-90K |
0.31% |
0.37% |
81.45 |
|
| £90-95K |
0.24% |
0.31% |
79.93 |
|
| £95-100K |
0.20% |
0.25% |
78.48 |
|
| £100K + |
0.95% |
1.34% |
70.68 |
|
|
|

|


|
1992-1997
|
1997-2001
|
|
|
|
| Con |
-10.94% |
| Lab |
10.62% |
| LD |
-3.13% |
|
| Con |
2.75% |
| Lab |
5.03% |
| LD |
-7.64% |
|
|
 |
Tim Loughton
Conservative hold
|
| Con |
 |
18,608 |
43.21% |
| Lab |
 |
12,469 |
28.95% |
| LD |
 |
9,876 |
22.93% |
| Oth |
 |
2,115 |
4.91% |
| Maj |
 |
6,139 |
14.25% |
| Turn |
 |
43,068 |
59.91% |
|
|
 |
Tim Loughton
Conservative hold
|
| LCA |
Christopher Baldwin |
920 |
2.14% |
| LD |
Paul Elgood |
9,876 |
22.93% |
| C |
Tim Loughton |
18,608 |
43.21% |
| UK |
Jim McCulloch |
1,195 |
2.77% |
| L |
Daniel Yates |
12,469 |
28.95% |
|
Candidates representing 5 parties stood for election to this seat.
|
|
 |
Tim Loughton
Conservative
|
| Con |
 |
20,864 |
40.46% |
| Lab |
 |
12,335 |
23.92% |
| LD |
 |
15,766 |
30.57% |
| Ref |
 |
1,683 |
3.26% |
| Oth |
 |
921 |
1.79% |
| Maj |
 |
5,098 |
9.89% |
| Turn |
 |
51,569 |
72.87% |
|
|
 |
|
Conservative
|
| Con |
 |
28,824 |
51.40% |
| Lab |
 |
7,476 |
13.30% |
| LD |
 |
18,919 |
33.70% |
| Oth |
 |
909 |
1.60% |
| Maj |
 |
9,905 |
17.60% |
| Turn |
 |
56,128 |
78.07% |
|
|
 |
|

|

