|
Blackburn
Labour hold

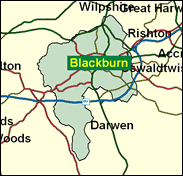
The Home Secretary's seat displays a variety of British urban charactersitics without posing any particularly pressing problems. There is a large Asian minority, concentrated in the old terraced housing of Brookhouse ward. There are almost all white council estates such as Shadworth. There are leafy residential areas, particularly to the north west around Corporation Park and the fine East Lancashire cricket club ground. This is a seat with a long and strong tradition of electing senior Labour party figures. Before Jack Straw took over in 1979, the MP for over thirty years had been Barbara Castle, leading member of Harold Wilson's Cabinets and still a fiery campaigner for pensioners as she enters her nineties. Blackburn is not as cast iron in its majorities as some more heterogeneous seats, but it is inconceivable that it should elect a Conservative in foreseeable circumstances.

As part of the Blairite strategy of outflanking the Tories in policy areas once owned by them (in this case law and order), Home Secretary Jack Straw has fallen foul of the civil libertarians on freedom of information, jury trials, and asylum seekers, prompting backbench revolts, but hopefully playing well with an electorate casting rather more than the 40 votes of the PLP's hardcore rebels. Born 1946, educated at Brentwood School and Leeds University, and nominally a lawyer, he has actually been a professional politician since student days, running the NUS and bag-carrying for Peter Shore and Barbara Castle until taking over her Blackburn seat in 1979. He skilfully played the Pinochet case, bouncing him around the appeal courts for months to please the Left, but then letting him go to please the rest, and so preserve his own leadership hopes. His pinched poker face, small wire-rimmed spectacles, austere demeanour and intense style, recall Sir Stafford Cripps.

 |
| Wealthy Achievers, Suburban Areas |
4.95% |
14.99% |
33.02 |
|
| Affluent Greys, Rural Communities |
0.00% |
2.13% |
0.00 |
|
| Prosperous Pensioners, Retirement Areas |
0.06% |
2.49% |
2.55 |
|
| Affluent Executives, Family Areas |
1.46% |
4.43% |
33.04 |
|
| Well-Off Workers, Family Areas |
6.02% |
7.27% |
82.79 |
|
| Affluent Urbanites, Town & City Areas |
0.45% |
2.56% |
17.72 |
|
| Prosperous Professionals, Metropolitan Areas |
0.00% |
2.04% |
0.00 |
|
| Better-Off Executives, Inner City Areas |
0.49% |
3.94% |
12.51 |
|
| Comfortable Middle Agers, Mature Home Owning Areas |
7.11% |
13.04% |
54.51 |
|
| Skilled Workers, Home Owning Areas |
23.12% |
12.70% |
182.01 |
|
| New Home Owners, Mature Communities |
6.59% |
8.14% |
80.98 |
|
| White Collar Workers, Better-Off Multi Ethnic Areas |
1.70% |
4.02% |
42.21 |
|
| Older People, Less Prosperous Areas |
2.11% |
3.19% |
66.11 |
|
| Council Estate Residents, Better-Off Homes |
22.47% |
11.31% |
198.67 |
|
| Council Estate Residents, High Unemployment |
3.81% |
3.06% |
124.40 |
|
| Council Estate Residents, Greatest Hardship |
7.79% |
2.52% |
309.36 |
|
| People in Multi-Ethnic, Low-Income Areas |
11.86% |
2.10% |
564.64 |
|
| Unclassified |
0.00% |
0.06% |
0.00 |
|
|
 |
|
|
| £0-5K |
14.94% |
9.41% |
158.66 |
|
| £5-10K |
22.13% |
16.63% |
133.08 |
|
| £10-15K |
18.98% |
16.58% |
114.49 |
|
| £15-20K |
13.60% |
13.58% |
100.12 |
|
| £20-25K |
9.23% |
10.39% |
88.79 |
|
| £25-30K |
6.20% |
7.77% |
79.76 |
|
| £30-35K |
4.20% |
5.79% |
72.47 |
|
| £35-40K |
2.88% |
4.33% |
66.51 |
|
| £40-45K |
2.01% |
3.27% |
61.58 |
|
| £45-50K |
1.43% |
2.48% |
57.45 |
|
| £50-55K |
1.03% |
1.90% |
53.94 |
|
| £55-60K |
0.75% |
1.47% |
50.92 |
|
| £60-65K |
0.56% |
1.15% |
48.30 |
|
| £65-70K |
0.42% |
0.91% |
46.00 |
|
| £70-75K |
0.32% |
0.72% |
43.97 |
|
| £75-80K |
0.24% |
0.57% |
42.16 |
|
| £80-85K |
0.19% |
0.46% |
40.54 |
|
| £85-90K |
0.15% |
0.37% |
39.07 |
|
| £90-95K |
0.12% |
0.31% |
37.74 |
|
| £95-100K |
0.09% |
0.25% |
36.53 |
|
| £100K + |
0.42% |
1.34% |
31.01 |
|
|
|
|


|
1992-1997
|
1997-2001
|
|
|
|
| Con |
-12.89% |
| Lab |
6.64% |
| LD |
-0.99% |
|
| Con |
6.41% |
| Lab |
-1.17% |
| LD |
-2.44% |
|
|
|
Jack Straw
Labour hold
|
| Con |
 |
12,559 |
31.02% |
| Lab |
 |
21,808 |
53.87% |
| LD |
 |
3,264 |
8.06% |
| Oth |
 |
2,853 |
7.05% |
| Maj |
 |
9,249 |
22.85% |
| Turn |
|
40,484 |
55.75% |
|
|
|
Jack Straw
Labour hold
|
| UK |
Dorothy Baxter |
1,185 |
2.93% |
| C |
John Cotton |
12,559 |
31.02% |
| SL |
Terence Cullen |
559 |
1.38% |
| I |
Paul Morris |
577 |
1.43% |
| S |
Frederick Nichol |
532 |
1.31% |
| LD |
Imtiaz Patel |
3,264 |
8.06% |
| L |
Jack Straw |
21,808 |
53.87% |
|
Candidates representing 7 parties stood for election to this seat.
|
|
|
Jack Straw
Labour
|
| Con |
|
11,690 |
24.61% |
| Lab |
|
26,141 |
55.04% |
| LD |
|
4,990 |
10.51% |
| Ref |
 |
1,892 |
3.98% |
| Oth |
|
2,784 |
5.86% |
| Maj |
|
14,451 |
30.43% |
| Turn |
|
47,497 |
65.01% |
|
|
|
|
Labour
|
| Con |
|
20,606 |
37.50% |
| Lab |
|
26,633 |
48.40% |
| LD |
|
6,332 |
11.50% |
| Oth |
|
1,407 |
2.60% |
| Maj |
|
6,027 |
11.00% |
| Turn |
|
54,978 |
74.79% |
|
|
|
|
|