|
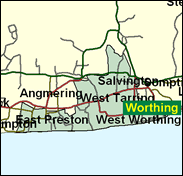
Worthing West
Conservative hold

The safer of the two Worthing seats, probably because it has more of Worthing in it, this south coast seat provided a refuge for a valuable if somewhat eccentric member of the Commons in 1997, when he recognised that his Eltham seat could not survive a Labour surge. This seat may well contain the most pensioners and therefore count as the most elderly (and therefore the most female) of any in the UK. Peter Bottomley can probably rely on the "Golden Girls" of Worthing by the true blue English Channel to secure his seventh parliamentary victory.

Peter Bottomley chicken-ran here in 1997 from Labour-threatened Eltham (which he had represented, originally as Woolwich West, since 1975). His short, three-year ministerial career in the late 1980s is recalled, if at all, for his outspoken attacks on drink-driving. A Europhile wet, he was born 1944, son of a diplomat and educated at Westminster School and Trinity College, Cambridge before working in advertising. Seen (by Craig Brown) as exhibiting a "twinge of loopiness", he cycles round London, smiles a good deal, and is well-supplied with the self-absorption of the politician with a mission, but whose objectives might not seem immediately clear.
 |
| Wealthy Achievers, Suburban Areas |
10.60% |
14.99% |
70.68 |
|
| Affluent Greys, Rural Communities |
0.00% |
2.13% |
0.00 |
|
| Prosperous Pensioners, Retirement Areas |
33.72% |
2.49% |
1,356.46 |
|
| Affluent Executives, Family Areas |
1.03% |
4.43% |
23.27 |
|
| Well-Off Workers, Family Areas |
2.67% |
7.27% |
36.65 |
|
| Affluent Urbanites, Town & City Areas |
1.23% |
2.56% |
48.07 |
|
| Prosperous Professionals, Metropolitan Areas |
0.03% |
2.04% |
1.41 |
|
| Better-Off Executives, Inner City Areas |
5.88% |
3.94% |
149.00 |
|
| Comfortable Middle Agers, Mature Home Owning Areas |
19.37% |
13.04% |
148.53 |
|
| Skilled Workers, Home Owning Areas |
8.68% |
12.70% |
68.36 |
|
| New Home Owners, Mature Communities |
7.06% |
8.14% |
86.74 |
|
| White Collar Workers, Better-Off Multi Ethnic Areas |
3.31% |
4.02% |
82.34 |
|
| Older People, Less Prosperous Areas |
2.51% |
3.19% |
78.81 |
|
| Council Estate Residents, Better-Off Homes |
3.03% |
11.31% |
26.79 |
|
| Council Estate Residents, High Unemployment |
0.66% |
3.06% |
21.57 |
|
| Council Estate Residents, Greatest Hardship |
0.22% |
2.52% |
8.70 |
|
| People in Multi-Ethnic, Low-Income Areas |
0.00% |
2.10% |
0.00 |
|
| Unclassified |
0.00% |
0.06% |
0.00 |
|
|
 |
 |
 |
| £0-5K |
9.04% |
9.41% |
95.98 |
|
| £5-10K |
16.11% |
16.63% |
96.83 |
|
| £10-15K |
16.51% |
16.58% |
99.61 |
|
| £15-20K |
13.83% |
13.58% |
101.79 |
|
| £20-25K |
10.71% |
10.39% |
103.07 |
|
| £25-30K |
8.05% |
7.77% |
103.61 |
|
| £30-35K |
6.00% |
5.79% |
103.58 |
|
| £35-40K |
4.47% |
4.33% |
103.16 |
|
| £40-45K |
3.35% |
3.27% |
102.46 |
|
| £45-50K |
2.52% |
2.48% |
101.57 |
|
| £50-55K |
1.92% |
1.90% |
100.56 |
|
| £55-60K |
1.47% |
1.47% |
99.47 |
|
| £60-65K |
1.13% |
1.15% |
98.35 |
|
| £65-70K |
0.88% |
0.91% |
97.20 |
|
| £70-75K |
0.69% |
0.72% |
96.05 |
|
| £75-80K |
0.55% |
0.57% |
94.91 |
|
| £80-85K |
0.43% |
0.46% |
93.78 |
|
| £85-90K |
0.35% |
0.37% |
92.67 |
|
| £90-95K |
0.28% |
0.31% |
91.59 |
|
| £95-100K |
0.23% |
0.25% |
90.53 |
|
| £100K + |
1.13% |
1.34% |
84.02 |
|
|
|

|


|
1992-1997
|
1997-2001
|
|
|
|
| Con |
-15.56% |
| Lab |
7.53% |
| LD |
3.64% |
|
| Con |
1.33% |
| Lab |
5.23% |
| LD |
-4.59% |
|
|
 |
Peter Bottomley
Conservative hold
|
| Con |
 |
20,508 |
47.46% |
| Lab |
 |
9,270 |
21.45% |
| LD |
 |
11,471 |
26.55% |
| Oth |
 |
1,960 |
4.54% |
| Maj |
 |
9,037 |
20.91% |
| Turn |
 |
43,209 |
59.67% |
|
|
 |
Peter Bottomley
Conservative hold
|
| C |
Peter Bottomley |
20,508 |
47.46% |
| L |
Alan Butcher |
9,270 |
21.45% |
| UK |
Tim Cross |
1,960 |
4.54% |
| LD |
James Walsh |
11,471 |
26.55% |
|
Candidates representing 4 parties stood for election to this seat.
|
|
 |
Peter Bottomley
Conservative
|
| Con |
 |
23,733 |
46.14% |
| Lab |
 |
8,347 |
16.23% |
| LD |
 |
16,020 |
31.14% |
| Ref |
 |
2,313 |
4.50% |
| Oth |
 |
1,029 |
2.00% |
| Maj |
 |
7,713 |
14.99% |
| Turn |
 |
51,442 |
72.12% |
|
|
 |
|
Conservative
|
| Con |
 |
34,762 |
61.70% |
| Lab |
 |
4,883 |
8.70% |
| LD |
 |
15,483 |
27.50% |
| Oth |
 |
1,175 |
2.10% |
| Maj |
 |
19,279 |
34.20% |
| Turn |
 |
56,303 |
78.46% |
|
|
 |
|

|

