|
Wrekin, The
Labour hold

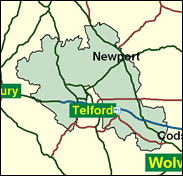
It was always expected that Labour would win the Telford seat after Shropshire was granted an extra constituency in the 1995 boundary changes. However that they should also gain The Wrekin was much more unexpected. This mid Shropshire seat was predominantly rural (Peter Bradley became the chairman of the group of Labour MPs with rural interests, which is larger than one might think, given their broad self-definition of rural, which doesn't mean quite the same as agricultural nowadays in the days of countryside 'wannabees') and included virtually none of the working class new town which had become the largest urban unit in the county. Many observers believe that Bradley will be a one-term MP, but he has been, as he has had to be, lively and may have built up a sufficient incumbency vote to make the difference in the expected close contest at the next general election.

Peter Bradley was elected in 1997 as one of three new Labour MPs to have launched careers as Westminster City councillors in opposition to Shirley Porter's alleged homes-for-votes affair. He has sought to maintain a high profile, as befits a metropolitan PR man unexpectedly located in rural Shropshire, leading calls for a rural affairs ministry. Born 1953 and educated at Abingdon School and Sussex University, he has also spent time targeting Tory Party Treasurer Michael Ashcroft. For the Conservatives Jacob Rees-Mogg presents the eccentric persona of a Woosterish young fogey with plastered-down hair and the datedly impeccable speech of one who might have attended Eton and Trinity College, Oxford in the 1930s rather than the 1980s. Born in 1969 and son of former Times editor, Lord Rees-Mogg, he is a merchant banker, originally with Rothschilds, backs Business for Sterling, and other Eurosceptic groups, and the Countryside Alliance, and fought Central Fife in 1997 with the assistance of his nanny.
 |
| Wealthy Achievers, Suburban Areas |
20.99% |
14.99% |
140.01 |
|
| Affluent Greys, Rural Communities |
0.60% |
2.13% |
28.21 |
|
| Prosperous Pensioners, Retirement Areas |
0.05% |
2.49% |
1.89 |
|
| Affluent Executives, Family Areas |
11.80% |
4.43% |
266.58 |
|
| Well-Off Workers, Family Areas |
11.22% |
7.27% |
154.26 |
|
| Affluent Urbanites, Town & City Areas |
0.57% |
2.56% |
22.38 |
|
| Prosperous Professionals, Metropolitan Areas |
0.04% |
2.04% |
2.19 |
|
| Better-Off Executives, Inner City Areas |
0.15% |
3.94% |
3.91 |
|
| Comfortable Middle Agers, Mature Home Owning Areas |
14.02% |
13.04% |
107.52 |
|
| Skilled Workers, Home Owning Areas |
9.52% |
12.70% |
74.91 |
|
| New Home Owners, Mature Communities |
14.21% |
8.14% |
174.47 |
|
| White Collar Workers, Better-Off Multi Ethnic Areas |
0.00% |
4.02% |
0.00 |
|
| Older People, Less Prosperous Areas |
4.53% |
3.19% |
142.36 |
|
| Council Estate Residents, Better-Off Homes |
9.44% |
11.31% |
83.50 |
|
| Council Estate Residents, High Unemployment |
0.61% |
3.06% |
19.82 |
|
| Council Estate Residents, Greatest Hardship |
2.18% |
2.52% |
86.43 |
|
| People in Multi-Ethnic, Low-Income Areas |
0.00% |
2.10% |
0.00 |
|
| Unclassified |
0.07% |
0.06% |
105.64 |
|
|
 |
 |
 |
| £0-5K |
9.28% |
9.41% |
98.63 |
|
| £5-10K |
16.76% |
16.63% |
100.77 |
|
| £10-15K |
16.88% |
16.58% |
101.82 |
|
| £15-20K |
13.91% |
13.58% |
102.39 |
|
| £20-25K |
10.64% |
10.39% |
102.42 |
|
| £25-30K |
7.92% |
7.77% |
101.89 |
|
| £30-35K |
5.84% |
5.79% |
100.88 |
|
| £35-40K |
4.31% |
4.33% |
99.48 |
|
| £40-45K |
3.19% |
3.27% |
97.80 |
|
| £45-50K |
2.38% |
2.48% |
95.94 |
|
| £50-55K |
1.79% |
1.90% |
93.98 |
|
| £55-60K |
1.36% |
1.47% |
91.99 |
|
| £60-65K |
1.04% |
1.15% |
90.01 |
|
| £65-70K |
0.80% |
0.91% |
88.07 |
|
| £70-75K |
0.62% |
0.72% |
86.19 |
|
| £75-80K |
0.48% |
0.57% |
84.38 |
|
| £80-85K |
0.38% |
0.46% |
82.64 |
|
| £85-90K |
0.30% |
0.37% |
80.99 |
|
| £90-95K |
0.24% |
0.31% |
79.43 |
|
| £95-100K |
0.19% |
0.25% |
77.94 |
|
| £100K + |
0.94% |
1.34% |
70.03 |
|
|
|

|


|
1992-1997
|
1997-2001
|
|
|
|
| Con |
-7.56% |
| Lab |
15.03% |
| LD |
-6.47% |
|
| Con |
-1.81% |
| Lab |
0.15% |
| LD |
-1.41% |
|
|
 |
Peter Bradley
Labour hold
|
| Con |
 |
15,945 |
38.43% |
| Lab |
 |
19,532 |
47.08% |
| LD |
 |
4,738 |
11.42% |
| Oth |
 |
1,275 |
3.07% |
| Maj |
 |
3,587 |
8.65% |
| Turn |
 |
41,490 |
100.00% |
|
|
 |
Peter Bradley
Labour hold
|
| L |
Peter Bradley |
19,532 |
47.08% |
| UK |
Denis Brookes |
1,275 |
3.07% |
| LD |
Ian Jenkins |
4,738 |
11.42% |
| C |
Jacob Rees Mogg |
15,945 |
38.43% |
|
Candidates representing 4 parties stood for election to this seat.
|
|
 |
Peter Bradley
Labour gain
|
| Con |
 |
18,218 |
40.24% |
| Lab |
 |
21,243 |
46.93% |
| LD |
 |
5,807 |
12.83% |
| Ref |
|
0 |
0.00% |
| Oth |
|
0 |
0.00% |
| Maj |
 |
3,025 |
6.68% |
| Turn |
 |
45,268 |
76.56% |
|
|
 |
|
Conservative
|
| Con |
 |
23,259 |
47.80% |
| Lab |
 |
15,539 |
31.90% |
| LD |
 |
9,391 |
19.30% |
| Oth |
 |
489 |
1.00% |
| Maj |
 |
7,720 |
15.90% |
| Turn |
 |
48,678 |
83.78% |
|
|
 |
|

|

