|
Wrexham
Labour hold

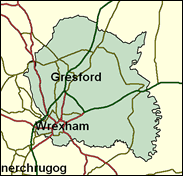
Wrexham was once the mining capital of South Wales, surrounded by a coalfield which reached public notice with the Gresford colliery disaster of 1934, in which hundreds of men were killed. The town is still ringed by large villages full of chapels, places like Llay, Brymbo and Rhosllanerchrugog which were one completely dependent on mineral extractive industry. Now however the whole area has been transformed by economic diversification and development, as new investment has flowed in to create a wide variety of employment. There is a vast industrial estate covering several square miles in the countryside east of Wrexham. Unemployment is now below the average for Wales. Apart from 1983, when the result was distorted by the defection of the local Labour MP Tom Ellis to the SDP and his old party's majority slipped to 424 over the Conservatives, this has long been a safe Labour seat. There are middle class and more Conservative areas such as the village of Holt and Borras Park in the north east of the town, with its new private estates, but this is more than balanced by Labour strongholds like Caia Park in the south west. Dr John Marek, member for 18 years, is moving to the Welsh Assembly full time having been sent there very convincingly in 1999, but will be able to pass the seat on successfully to Ian Lucas.

Ian Lucas, Labour's fresh-faced replacement here for Welsh-Assembly-departed John Marek, is a solicitor. He was born in 1960 and raised in a council house, the grandson of a Durham miner. He was educated at Greenwell Comprehensive, Gateshead, Newcastle Royal Grammar School, New College, Oxford, and Chester Law College. Sometime Chairman of Wrexham CLP, his legal business is currently Oswestry-based and has acted on behalf of Trevor Rees-Jones, the bodyguard who survived the Princess of Wales' fatal car crash and whom Lucas advised over publication of his version of the events in the face of opposition from Mohamed Fayed.
 |
| Wealthy Achievers, Suburban Areas |
10.82% |
14.99% |
72.15 |
|
| Affluent Greys, Rural Communities |
1.28% |
2.13% |
59.98 |
|
| Prosperous Pensioners, Retirement Areas |
1.50% |
2.49% |
60.37 |
|
| Affluent Executives, Family Areas |
6.76% |
4.43% |
152.82 |
|
| Well-Off Workers, Family Areas |
11.14% |
7.27% |
153.20 |
|
| Affluent Urbanites, Town & City Areas |
0.02% |
2.56% |
0.88 |
|
| Prosperous Professionals, Metropolitan Areas |
0.00% |
2.04% |
0.00 |
|
| Better-Off Executives, Inner City Areas |
0.52% |
3.94% |
13.23 |
|
| Comfortable Middle Agers, Mature Home Owning Areas |
12.24% |
13.04% |
93.87 |
|
| Skilled Workers, Home Owning Areas |
14.74% |
12.70% |
116.07 |
|
| New Home Owners, Mature Communities |
12.10% |
8.14% |
148.63 |
|
| White Collar Workers, Better-Off Multi Ethnic Areas |
2.96% |
4.02% |
73.52 |
|
| Older People, Less Prosperous Areas |
5.34% |
3.19% |
167.54 |
|
| Council Estate Residents, Better-Off Homes |
15.78% |
11.31% |
139.52 |
|
| Council Estate Residents, High Unemployment |
1.15% |
3.06% |
37.62 |
|
| Council Estate Residents, Greatest Hardship |
3.64% |
2.52% |
144.68 |
|
| People in Multi-Ethnic, Low-Income Areas |
0.00% |
2.10% |
0.00 |
|
| Unclassified |
0.00% |
0.06% |
0.00 |
|
|
 |
 |
 |
| £0-5K |
10.63% |
9.41% |
112.91 |
|
| £5-10K |
18.71% |
16.63% |
112.49 |
|
| £10-15K |
18.09% |
16.58% |
109.13 |
|
| £15-20K |
14.31% |
13.58% |
105.38 |
|
| £20-25K |
10.53% |
10.39% |
101.31 |
|
| £25-30K |
7.54% |
7.77% |
97.00 |
|
| £30-35K |
5.36% |
5.79% |
92.58 |
|
| £35-40K |
3.82% |
4.33% |
88.20 |
|
| £40-45K |
2.74% |
3.27% |
83.94 |
|
| £45-50K |
1.98% |
2.48% |
79.89 |
|
| £50-55K |
1.45% |
1.90% |
76.08 |
|
| £55-60K |
1.07% |
1.47% |
72.51 |
|
| £60-65K |
0.80% |
1.15% |
69.20 |
|
| £65-70K |
0.60% |
0.91% |
66.13 |
|
| £70-75K |
0.46% |
0.72% |
63.29 |
|
| £75-80K |
0.35% |
0.57% |
60.66 |
|
| £80-85K |
0.27% |
0.46% |
58.23 |
|
| £85-90K |
0.21% |
0.37% |
55.98 |
|
| £90-95K |
0.16% |
0.31% |
53.90 |
|
| £95-100K |
0.13% |
0.25% |
51.96 |
|
| £100K + |
0.57% |
1.34% |
42.63 |
|
|
|

|


|
1992-1997
|
1997-2001
|
|
|
|
| Con |
-8.55% |
| Lab |
6.15% |
| LD |
-1.73% |
| PC |
0.51% |
|
| Con |
-2.37% |
| Lab |
-5.40% |
| LD |
3.14% |
| PC |
2.47% |
|
|
 |
Ian Lucas
Labour hold
|
| Con |
 |
6,746 |
21.48% |
| Lab |
 |
15,934 |
50.75% |
| LD |
 |
5,153 |
16.41% |
| PC |
 |
1,783 |
5.68% |
| Oth |
 |
1,783 |
5.68% |
| Maj |
 |
9,188 |
29.26% |
| Turn |
 |
31,399 |
62.22% |
|
|
 |
Ian Lucas
Labour hold
|
| UK |
Jane Brookes |
1,783 |
5.68% |
| LD |
Ron Davies |
5,153 |
16.41% |
| C |
Felicity Elphick |
6,746 |
21.48% |
| PC |
Malcolm Evans |
1,783 |
5.68% |
| L |
Ian Lucas |
15,934 |
50.75% |
|
Candidates representing 5 parties stood for election to this seat.
|
|
 |
John Marek
Labour
|
| Con |
 |
8,688 |
23.85% |
| Lab |
 |
20,450 |
56.15% |
| LD |
 |
4,833 |
13.27% |
| PC |
 |
1,170 |
3.21% |
| Ref |
 |
1,195 |
3.28% |
| Oth |
 |
86 |
0.24% |
| Maj |
 |
11,762 |
32.29% |
| Turn |
 |
36,422 |
71.78% |
|
|
 |
|
Labour
|
| Con |
 |
13,101 |
32.40% |
| Lab |
 |
20,191 |
50.00% |
| LD |
 |
6,054 |
15.00% |
| PC |
 |
1,075 |
2.70% |
| Oth |
|
0 |
0.00% |
| Maj |
 |
7,090 |
17.50% |
| Turn |
 |
40,421 |
78.77% |
|
|
 |
|

|

