|
Wycombe
Conservative hold

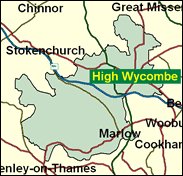
If Labour were to make a further advance at the next election, Wycombe would come within their range, and the senior Daily Telegraph journalist Paul Goodman should treat this Buckinghamshire Chilterns seat straddling the M40 as a marginal. High Wycombe itself has strong pockets of Labour support in wards like Booker & Castlefield and Oakridge & Tinkers Wood, but not so much outside ampersand country in Bourne End-cum-Hensor, Flackwell Heath, Hughenden Valley and most of all, the second largest town, Marlow.

Paul Goodman, Telegraph journalist and Eurosceptic, has replaced the retiring Europhile MP, Sir Ray Whitney as Conservative candidate. Born 1959 and educated at Cranleigh School and York University, he cites as an 'achievement' "playing my part in ensuring that the Daily Telegraph is the main newspaper holding this Labour government properly to account". One of William Hague's speechwriters, and a former Chairman of the Federation of Conservative Students, he has changed from backing immediate legalisation of drugs to favouring gradual decriminalisation. A novice candidate in this safe Tory seat, he spent, despite Jewish parentage, two years as a novice monk and a further year as home affairs editor on the Catholic Herald.
 |
| Wealthy Achievers, Suburban Areas |
27.09% |
14.99% |
180.66 |
|
| Affluent Greys, Rural Communities |
0.29% |
2.13% |
13.81 |
|
| Prosperous Pensioners, Retirement Areas |
0.67% |
2.49% |
27.09 |
|
| Affluent Executives, Family Areas |
7.10% |
4.43% |
160.34 |
|
| Well-Off Workers, Family Areas |
14.73% |
7.27% |
202.53 |
|
| Affluent Urbanites, Town & City Areas |
5.18% |
2.56% |
202.15 |
|
| Prosperous Professionals, Metropolitan Areas |
0.01% |
2.04% |
0.53 |
|
| Better-Off Executives, Inner City Areas |
1.32% |
3.94% |
33.44 |
|
| Comfortable Middle Agers, Mature Home Owning Areas |
7.35% |
13.04% |
56.40 |
|
| Skilled Workers, Home Owning Areas |
7.51% |
12.70% |
59.11 |
|
| New Home Owners, Mature Communities |
4.92% |
8.14% |
60.37 |
|
| White Collar Workers, Better-Off Multi Ethnic Areas |
6.10% |
4.02% |
151.69 |
|
| Older People, Less Prosperous Areas |
3.87% |
3.19% |
121.54 |
|
| Council Estate Residents, Better-Off Homes |
10.04% |
11.31% |
88.80 |
|
| Council Estate Residents, High Unemployment |
0.32% |
3.06% |
10.29 |
|
| Council Estate Residents, Greatest Hardship |
0.68% |
2.52% |
27.09 |
|
| People in Multi-Ethnic, Low-Income Areas |
2.78% |
2.10% |
132.15 |
|
| Unclassified |
0.04% |
0.06% |
59.67 |
|
|
 |
 |
 |
| £0-5K |
5.32% |
9.41% |
56.54 |
|
| £5-10K |
10.42% |
16.63% |
62.66 |
|
| £10-15K |
12.27% |
16.58% |
73.99 |
|
| £15-20K |
11.81% |
13.58% |
86.94 |
|
| £20-25K |
10.42% |
10.39% |
100.25 |
|
| £25-30K |
8.81% |
7.77% |
113.33 |
|
| £30-35K |
7.29% |
5.79% |
125.87 |
|
| £35-40K |
5.97% |
4.33% |
137.70 |
|
| £40-45K |
4.86% |
3.27% |
148.76 |
|
| £45-50K |
3.95% |
2.48% |
159.03 |
|
| £50-55K |
3.21% |
1.90% |
168.52 |
|
| £55-60K |
2.61% |
1.47% |
177.27 |
|
| £60-65K |
2.13% |
1.15% |
185.32 |
|
| £65-70K |
1.75% |
0.91% |
192.72 |
|
| £70-75K |
1.43% |
0.72% |
199.51 |
|
| £75-80K |
1.18% |
0.57% |
205.75 |
|
| £80-85K |
0.98% |
0.46% |
211.47 |
|
| £85-90K |
0.81% |
0.37% |
216.72 |
|
| £90-95K |
0.68% |
0.31% |
221.55 |
|
| £95-100K |
0.56% |
0.25% |
225.97 |
|
| £100K + |
3.29% |
1.34% |
245.03 |
|
|
|

|


|
1992-1997
|
1997-2001
|
|
|
|
| Con |
-13.37% |
| Lab |
14.00% |
| LD |
-4.50% |
|
| Con |
2.46% |
| Lab |
-0.05% |
| LD |
-1.47% |
|
|
 |
Paul Goodman
Conservative hold
|
| Con |
 |
19,064 |
42.39% |
| Lab |
 |
15,896 |
35.34% |
| LD |
 |
7,658 |
17.03% |
| Oth |
 |
2,356 |
5.24% |
| Maj |
 |
3,168 |
7.04% |
| Turn |
 |
44,974 |
60.25% |
|
|
 |
Paul Goodman
Conservative hold
|
| UK |
Christopher Cooke |
1,059 |
2.35% |
| I |
David Fitton |
240 |
0.53% |
| C |
Paul Goodman |
19,064 |
42.39% |
| G |
John Laker |
1,057 |
2.35% |
| L |
Chauhdry Shafique |
15,896 |
35.34% |
| LD |
Dee Tomlin |
7,658 |
17.03% |
|
Candidates representing 6 parties stood for election to this seat.
|
|
 |
Ray Whitney
Conservative
|
| Con |
 |
20,890 |
39.93% |
| Lab |
 |
18,520 |
35.40% |
| LD |
 |
9,678 |
18.50% |
| Ref |
 |
2,394 |
4.58% |
| Oth |
 |
837 |
1.60% |
| Maj |
 |
2,370 |
4.53% |
| Turn |
 |
52,319 |
71.10% |
|
|
 |
|
Conservative
|
| Con |
 |
30,040 |
53.30% |
| Lab |
 |
12,096 |
21.40% |
| LD |
 |
12,982 |
23.00% |
| Oth |
 |
1,295 |
2.30% |
| Maj |
 |
17,058 |
30.20% |
| Turn |
 |
56,413 |
77.50% |
|
|
 |
|

|

