|
Ynys-Mon
Labour gain

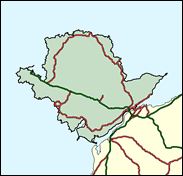
Once almost at the beginning of the alphabet, when it was named Anglesey, this island constituency off the north west coast of Wales is now very close to the end. Few can argue with the name change in 1983, for 62pc of the residents can speak Welsh, and many prefer to do so as a first language. The seat does have Conservative elements as a tourist and retirement centre, particularly on its east coast, and the Conservative Keith Best held it from 1979 to 1987. Before him it had been Labour since 1951 (Welsh and Agriculture Secretary Cledwyn Hughes), and before that Liberal, in the formidable shape of Lady Megan Lloyd George, the last Liberal Prime Minister's sister. But in 1987 Plaid Cymru became the fourth party to hold the island since the war and Ieuan Wyn Jones is now its leading figure, but he is to vacate his safe Ynys Mon (Isle of Anglesey) seat in the Commons at the next general election to lead the opposition to the ruling Labour / Liberal Democrat coalition in the Welsh Assembly.

Eilian Williams has been selected to replace Plaid Cymru leader Ieuan Wyn Jones, who has departed for the Welsh Assembly. Like his predecessor a solicitor, he was born 1950 and educated locally at Ysgol Uwchradd Holyhead and Aberystwyth University.
 |
| Wealthy Achievers, Suburban Areas |
16.13% |
14.99% |
107.58 |
|
| Affluent Greys, Rural Communities |
21.20% |
2.13% |
997.13 |
|
| Prosperous Pensioners, Retirement Areas |
3.67% |
2.49% |
147.75 |
|
| Affluent Executives, Family Areas |
3.06% |
4.43% |
69.15 |
|
| Well-Off Workers, Family Areas |
0.62% |
7.27% |
8.50 |
|
| Affluent Urbanites, Town & City Areas |
1.16% |
2.56% |
45.24 |
|
| Prosperous Professionals, Metropolitan Areas |
0.17% |
2.04% |
8.10 |
|
| Better-Off Executives, Inner City Areas |
0.30% |
3.94% |
7.64 |
|
| Comfortable Middle Agers, Mature Home Owning Areas |
18.42% |
13.04% |
141.28 |
|
| Skilled Workers, Home Owning Areas |
8.87% |
12.70% |
69.86 |
|
| New Home Owners, Mature Communities |
13.24% |
8.14% |
162.59 |
|
| White Collar Workers, Better-Off Multi Ethnic Areas |
1.22% |
4.02% |
30.46 |
|
| Older People, Less Prosperous Areas |
1.32% |
3.19% |
41.37 |
|
| Council Estate Residents, Better-Off Homes |
7.60% |
11.31% |
67.22 |
|
| Council Estate Residents, High Unemployment |
0.12% |
3.06% |
4.04 |
|
| Council Estate Residents, Greatest Hardship |
2.88% |
2.52% |
114.51 |
|
| People in Multi-Ethnic, Low-Income Areas |
0.00% |
2.10% |
0.00 |
|
| Unclassified |
0.00% |
0.06% |
0.00 |
|
|
 |
|
|
| £0-5K |
12.66% |
9.41% |
134.53 |
|
| £5-10K |
20.78% |
16.63% |
124.96 |
|
| £10-15K |
19.00% |
16.58% |
114.60 |
|
| £15-20K |
14.23% |
13.58% |
104.76 |
|
| £20-25K |
9.97% |
10.39% |
95.89 |
|
| £25-30K |
6.84% |
7.77% |
88.02 |
|
| £30-35K |
4.70% |
5.79% |
81.09 |
|
| £35-40K |
3.25% |
4.33% |
75.00 |
|
| £40-45K |
2.27% |
3.27% |
69.65 |
|
| £45-50K |
1.61% |
2.48% |
64.93 |
|
| £50-55K |
1.16% |
1.90% |
60.75 |
|
| £55-60K |
0.84% |
1.47% |
57.05 |
|
| £60-65K |
0.62% |
1.15% |
53.74 |
|
| £65-70K |
0.46% |
0.91% |
50.77 |
|
| £70-75K |
0.35% |
0.72% |
48.11 |
|
| £75-80K |
0.26% |
0.57% |
45.70 |
|
| £80-85K |
0.20% |
0.46% |
43.51 |
|
| £85-90K |
0.16% |
0.37% |
41.52 |
|
| £90-95K |
0.12% |
0.31% |
39.70 |
|
| £95-100K |
0.10% |
0.25% |
38.03 |
|
| £100K + |
0.41% |
1.34% |
30.26 |
|
|
|
|


|
1992-1997
|
1997-2001
|
|
|
|
| Con |
-13.14% |
| Lab |
9.75% |
| LD |
-0.55% |
| PC |
2.36% |
|
| Con |
1.04% |
| Lab |
1.75% |
| LD |
4.30% |
|
|
|
Albert Owen
Labour gain
|
| Con |
 |
7,653 |
22.50% |
| Lab |
 |
11,906 |
35.00% |
| LD |
 |
2,772 |
8.15% |
| PC |
 |
11,106 |
32.65% |
| Oth |
 |
581 |
1.71% |
| Maj |
 |
800 |
2.35% |
| Turn |
|
34,018 |
64.04% |
|
|
|
Albert Owen
Labour gain
|
| LD |
Nick Bennett |
2,772 |
8.15% |
| I |
Nona Donald |
222 |
0.65% |
| C |
Albie Fox |
7,653 |
22.50% |
| L |
Albert Owen |
11,906 |
35.00% |
| PC |
Eilian Williams |
11,106 |
32.65% |
| UK |
Francis Wykes |
359 |
1.06% |
|
Candidates representing 6 parties stood for election to this seat.
|
|
|
Ieuan Wyn Jones
Plaid Cymru
|
| Con |
|
8,569 |
21.46% |
| Lab |
|
13,275 |
33.25% |
| LD |
|
1,537 |
3.85% |
| PC |
|
15,756 |
39.46% |
| Ref |
 |
793 |
1.99% |
| Oth |
|
0 |
0.00% |
| Maj |
|
2,481 |
6.21% |
| Turn |
|
39,930 |
75.41% |
|
|
|
|
Plaid Cymru
|
| Con |
|
14,878 |
34.60% |
| Lab |
|
10,126 |
23.50% |
| LD |
|
1,891 |
4.40% |
| PC |
|
15,984 |
37.10% |
| Oth |
|
182 |
0.40% |
| Maj |
|
1,106 |
2.60% |
| Turn |
|
43,061 |
79.52% |
|
|
|
|
|