|
Yorkshire East
Conservative hold

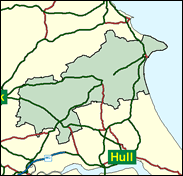
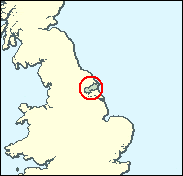
The county of Humberside existed from the 1970s to the 1990s, but it was never popular with residents on either bank of that river or estuary and now the proud traditions of Lincolnshire and the East Riding of Yorkshire have been restored. This seat, last - but of course none is least - of the 659 parliamentary constituencies, consists of Bridlington on the coast, together with inland country mainly to be found in the rolling Wolds around the market towns of Driffield, Market Drayton and Pocklington. Here too is Stamford Bridge, site of Harold Godwinson's first victory of 1066. However, there are few decisive battles likely in what is really a safe Conservative seat. Labour came second by only 3,000 votes in 1997, and did quite well in Bridlington town in the unitary authority elections for the reconstituted and reempowered East Riding of Yorkshire in May 1999, and indeed a pair of "Socialists" were actually elected in Bridlington Old Town. These stood in opposition to official Labour, which surely tells us much about British politics as we enter the new Millennium.

Greg Knight was originally MP for Derby North, which he entered on the Thatcherite flood of 1983 and left on the Blairite flood of 1997. Risen through the Whips Office, eventually serving as Deputy Chief Whip 1993-96, he has left few footprints, and served only briefly, as a DTI Minister. He is a solicitor, born 1949, and educated at Alderman Newton's Grammar School, Leicester and Guildford College of Law. A once-bearded bachelor, he has backed anti-hunting and the animal welfare bills and written books of parliamentary anecdotes. In April this year he was dubbed 'silent Knight' for refusing to condemn his retiring predecessor John Townend, who blamed "coloured immigrants" for rising crime and undermining Britain's 'Anglo-Saxon' society. He is one of eight former MPs selected - against Central Office advice - for seats other than those they lost in 1997. Labour's Tracey Simpson-Laing, a York city councillor (Acomb ward), was born in 1967.
 |
| Wealthy Achievers, Suburban Areas |
10.90% |
14.99% |
72.70 |
|
| Affluent Greys, Rural Communities |
10.98% |
2.13% |
516.27 |
|
| Prosperous Pensioners, Retirement Areas |
9.84% |
2.49% |
395.95 |
|
| Affluent Executives, Family Areas |
2.67% |
4.43% |
60.39 |
|
| Well-Off Workers, Family Areas |
5.83% |
7.27% |
80.14 |
|
| Affluent Urbanites, Town & City Areas |
0.64% |
2.56% |
24.96 |
|
| Prosperous Professionals, Metropolitan Areas |
0.00% |
2.04% |
0.00 |
|
| Better-Off Executives, Inner City Areas |
4.30% |
3.94% |
109.09 |
|
| Comfortable Middle Agers, Mature Home Owning Areas |
21.91% |
13.04% |
168.05 |
|
| Skilled Workers, Home Owning Areas |
13.16% |
12.70% |
103.60 |
|
| New Home Owners, Mature Communities |
7.36% |
8.14% |
90.34 |
|
| White Collar Workers, Better-Off Multi Ethnic Areas |
2.92% |
4.02% |
72.65 |
|
| Older People, Less Prosperous Areas |
2.64% |
3.19% |
82.87 |
|
| Council Estate Residents, Better-Off Homes |
4.93% |
11.31% |
43.55 |
|
| Council Estate Residents, High Unemployment |
0.52% |
3.06% |
17.06 |
|
| Council Estate Residents, Greatest Hardship |
1.40% |
2.52% |
55.45 |
|
| People in Multi-Ethnic, Low-Income Areas |
0.00% |
2.10% |
0.00 |
|
| Unclassified |
0.00% |
0.06% |
0.00 |
|
|
 |
 |
 |
| £0-5K |
9.80% |
9.41% |
104.15 |
|
| £5-10K |
18.80% |
16.63% |
113.05 |
|
| £10-15K |
18.54% |
16.58% |
111.81 |
|
| £15-20K |
14.57% |
13.58% |
107.29 |
|
| £20-25K |
10.59% |
10.39% |
101.92 |
|
| £25-30K |
7.51% |
7.77% |
96.57 |
|
| £30-35K |
5.30% |
5.79% |
91.53 |
|
| £35-40K |
3.76% |
4.33% |
86.88 |
|
| £40-45K |
2.70% |
3.27% |
82.64 |
|
| £45-50K |
1.96% |
2.48% |
78.80 |
|
| £50-55K |
1.43% |
1.90% |
75.32 |
|
| £55-60K |
1.06% |
1.47% |
72.17 |
|
| £60-65K |
0.80% |
1.15% |
69.33 |
|
| £65-70K |
0.61% |
0.91% |
66.76 |
|
| £70-75K |
0.46% |
0.72% |
64.42 |
|
| £75-80K |
0.36% |
0.57% |
62.31 |
|
| £80-85K |
0.28% |
0.46% |
60.38 |
|
| £85-90K |
0.22% |
0.37% |
58.63 |
|
| £90-95K |
0.17% |
0.31% |
57.03 |
|
| £95-100K |
0.14% |
0.25% |
55.56 |
|
| £100K + |
0.66% |
1.34% |
48.90 |
|
|
|

|


|
1992-1997
|
1997-2001
|
|
|
|
| Con |
-7.91% |
| Lab |
9.37% |
| LD |
-4.38% |
|
| Con |
3.17% |
| Lab |
-0.83% |
| LD |
-3.98% |
|
|
 |
Greg Knight
Conservative hold
|
| Con |
 |
19,861 |
45.85% |
| Lab |
 |
15,179 |
35.04% |
| LD |
 |
6,300 |
14.54% |
| Oth |
 |
1,974 |
4.56% |
| Maj |
 |
4,682 |
10.81% |
| Turn |
 |
43,314 |
59.87% |
|
|
 |
Greg Knight
Conservative hold
|
| I |
Paul Dessoy |
313 |
0.72% |
| LD |
Mary-Rose Hardy |
6,300 |
14.54% |
| C |
Greg Knight |
19,861 |
45.85% |
| UK |
Trevor Pearson |
1,661 |
3.83% |
| L |
Tracey Simpson-Laing |
15,179 |
35.04% |
|
Candidates representing 5 parties stood for election to this seat.
|
|
 |
John Townend
Conservative
|
| Con |
 |
20,904 |
42.69% |
| Lab |
 |
17,567 |
35.87% |
| LD |
 |
9,070 |
18.52% |
| Ref |
|
0 |
0.00% |
| Oth |
 |
1,430 |
2.92% |
| Maj |
 |
3,337 |
6.81% |
| Turn |
 |
48,971 |
70.55% |
|
|
 |
|
Conservative
|
| Con |
 |
25,759 |
50.60% |
| Lab |
 |
13,487 |
26.50% |
| LD |
 |
11,629 |
22.90% |
| Oth |
|
0 |
0.00% |
| Maj |
 |
12,272 |
24.10% |
| Turn |
 |
50,875 |
75.72% |
|
|
 |
|

|

