|
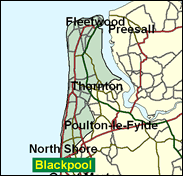
Blackpool North & Fleetwood
Labour hold

There were raised eyebrows when Joan Humble captured this seat in 1997, to join 100 other Labour women MPs, and predictions of a short tenure. It does however require a swing to the Tories of over 8 per cent, and unlike in some recent local elections, the evidence from the most recent municipal contests in May 1999, the Labour vote held up well: they won 17 of the 25 seats in the Wyre Borough (that is, Fleetwood) portion of the seat, for example, which if anything is actually more for Humble, as it were, than the parts taken from its larger neighbour to the south.

Joan Humble has indeed led a parliamentary life of blameless humility since arriving in 1997 on the Labour flood tide. Born (1951) Jovanka Piplica of Slav parentage, and educated at Greenstead Grammar School, Keighley and Lancaster University, she was a DHSS clerk and tax officer before becoming a full-time Lancashire county councillor for 12 years. A locally focused MP (tourism, fishing) she will not, as a technophobe, be able to access this profile.

 |
| Wealthy Achievers, Suburban Areas |
6.66% |
14.99% |
44.44 |
|
| Affluent Greys, Rural Communities |
0.41% |
2.13% |
19.46 |
|
| Prosperous Pensioners, Retirement Areas |
6.37% |
2.49% |
256.28 |
|
| Affluent Executives, Family Areas |
1.48% |
4.43% |
33.45 |
|
| Well-Off Workers, Family Areas |
2.81% |
7.27% |
38.64 |
|
| Affluent Urbanites, Town & City Areas |
2.26% |
2.56% |
88.27 |
|
| Prosperous Professionals, Metropolitan Areas |
0.00% |
2.04% |
0.00 |
|
| Better-Off Executives, Inner City Areas |
5.40% |
3.94% |
136.85 |
|
| Comfortable Middle Agers, Mature Home Owning Areas |
31.77% |
13.04% |
243.69 |
|
| Skilled Workers, Home Owning Areas |
15.85% |
12.70% |
124.80 |
|
| New Home Owners, Mature Communities |
14.00% |
8.14% |
171.92 |
|
| White Collar Workers, Better-Off Multi Ethnic Areas |
2.72% |
4.02% |
67.65 |
|
| Older People, Less Prosperous Areas |
2.65% |
3.19% |
83.29 |
|
| Council Estate Residents, Better-Off Homes |
4.23% |
11.31% |
37.36 |
|
| Council Estate Residents, High Unemployment |
2.75% |
3.06% |
89.74 |
|
| Council Estate Residents, Greatest Hardship |
0.61% |
2.52% |
24.05 |
|
| People in Multi-Ethnic, Low-Income Areas |
0.00% |
2.10% |
0.00 |
|
| Unclassified |
0.02% |
0.06% |
31.14 |
|
|
 |
 |
 |
| £0-5K |
10.47% |
9.41% |
111.25 |
|
| £5-10K |
19.31% |
16.63% |
116.08 |
|
| £10-15K |
18.89% |
16.58% |
113.91 |
|
| £15-20K |
14.75% |
13.58% |
108.62 |
|
| £20-25K |
10.61% |
10.39% |
102.09 |
|
| £25-30K |
7.41% |
7.77% |
95.32 |
|
| £30-35K |
5.14% |
5.79% |
88.78 |
|
| £35-40K |
3.58% |
4.33% |
82.69 |
|
| £40-45K |
2.52% |
3.27% |
77.12 |
|
| £45-50K |
1.79% |
2.48% |
72.06 |
|
| £50-55K |
1.29% |
1.90% |
67.50 |
|
| £55-60K |
0.93% |
1.47% |
63.38 |
|
| £60-65K |
0.69% |
1.15% |
59.67 |
|
| £65-70K |
0.51% |
0.91% |
56.31 |
|
| £70-75K |
0.38% |
0.72% |
53.27 |
|
| £75-80K |
0.29% |
0.57% |
50.51 |
|
| £80-85K |
0.22% |
0.46% |
48.00 |
|
| £85-90K |
0.17% |
0.37% |
45.70 |
|
| £90-95K |
0.13% |
0.31% |
43.60 |
|
| £95-100K |
0.10% |
0.25% |
41.67 |
|
| £100K + |
0.44% |
1.34% |
32.70 |
|
|
|

|


|
1992-1997
|
1997-2001
|
|
|
|
| Con |
-14.25% |
| Lab |
14.59% |
| LD |
-3.44% |
|
| Con |
1.77% |
| Lab |
-1.44% |
| LD |
1.15% |
|
|
 |
Joan Humble
Labour hold
|
| Con |
 |
15,889 |
37.31% |
| Lab |
 |
21,610 |
50.75% |
| LD |
 |
4,132 |
9.70% |
| Oth |
 |
950 |
2.23% |
| Maj |
 |
5,721 |
13.44% |
| Turn |
 |
42,581 |
57.19% |
|
|
 |
Joan Humble
Labour hold
|
| LD |
Steven Bate |
4,132 |
9.70% |
| L |
Joan Humble |
21,610 |
50.75% |
| UK |
Colin Porter |
950 |
2.23% |
| C |
Alan Vincent |
15,889 |
37.31% |
|
Candidates representing 4 parties stood for election to this seat.
|
|
 |
Joan Humble
Labour gain
|
| Con |
 |
19,105 |
35.55% |
| Lab |
 |
28,051 |
52.19% |
| LD |
 |
4,600 |
8.56% |
| Ref |
 |
1,704 |
3.17% |
| Oth |
 |
288 |
0.54% |
| Maj |
 |
8,946 |
16.64% |
| Turn |
 |
53,748 |
71.67% |
|
|
 |
|
Conservative
|
| Con |
 |
29,838 |
49.80% |
| Lab |
 |
22,562 |
37.60% |
| LD |
 |
7,167 |
12.00% |
| Oth |
 |
387 |
0.60% |
| Maj |
 |
7,276 |
12.10% |
| Turn |
 |
59,954 |
80.16% |
|
|
 |
|

|

