|
Blackpool South
Labour hold

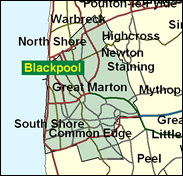
Until 1997 the idea of Labour MPs actually representing, rather than just visiting, the great northern seaside resort of Blackpool seemed counter-intuitive. Despite the bustling resort's plebeian qualities, and reputation built up as the destination for day and week trippers from the industrial powerhouses of the Lancashire towns, the image of the formidable seaside landlady in an economy based on services and tourism did not square easily with the Left. Yet things have changed. The British seaside has been very seriously challenged by affluence in general and by the aeroplane, and its ability to offer year round access at affordable prices to much more sun and sand, or even commodities which exercise the curiosity and intellect. Thousands of guest houses have been sold or have had to take in the sort of guests once rigorously excluded by the puritanical archetype of commercial prudery and snobbery. Although owner occupied, Blackpool is not middle class in residency, never mind guests. The bulk of the town is in this seat, which went Labour at local level years before electing Gordon Marsden as its first ever Labour MP in 1997. Even though the town in general and the Winter Gardens in particular do not offer the standard of facilities which satisfy New Labour, who confer elsewhere (the symbolism has not gone unnoticed) the permanent economic winter conditions In Blackpool should in the long run help the rather improbable figure of Gordon Marsden win again.

Gordon Marsden, born 1953, educated at Stockport Grammar School and New College Oxford is one of six declared homosexuals in the PLP. Elected here in 1997, a loyal Blairite - at least publicly - he knows as a professional historian how rarely Labour wins workable majorities. Self-assured, discerning and cerebral with closely-cropped peroxide-looking hair and matinée idol features, he retains his Brighton home, handier now for more Party Conferences than his address in unfashionable Blackpool, whose declining interests he inevitably defends as an MP.

 |
| Wealthy Achievers, Suburban Areas |
2.44% |
14.99% |
16.31 |
|
| Affluent Greys, Rural Communities |
2.84% |
2.13% |
133.69 |
|
| Prosperous Pensioners, Retirement Areas |
0.49% |
2.49% |
19.78 |
|
| Affluent Executives, Family Areas |
0.22% |
4.43% |
4.98 |
|
| Well-Off Workers, Family Areas |
0.91% |
7.27% |
12.49 |
|
| Affluent Urbanites, Town & City Areas |
1.87% |
2.56% |
72.84 |
|
| Prosperous Professionals, Metropolitan Areas |
0.00% |
2.04% |
0.00 |
|
| Better-Off Executives, Inner City Areas |
8.94% |
3.94% |
226.58 |
|
| Comfortable Middle Agers, Mature Home Owning Areas |
18.66% |
13.04% |
143.07 |
|
| Skilled Workers, Home Owning Areas |
31.42% |
12.70% |
247.38 |
|
| New Home Owners, Mature Communities |
9.81% |
8.14% |
120.53 |
|
| White Collar Workers, Better-Off Multi Ethnic Areas |
8.61% |
4.02% |
214.14 |
|
| Older People, Less Prosperous Areas |
4.18% |
3.19% |
131.22 |
|
| Council Estate Residents, Better-Off Homes |
6.38% |
11.31% |
56.44 |
|
| Council Estate Residents, High Unemployment |
2.99% |
3.06% |
97.51 |
|
| Council Estate Residents, Greatest Hardship |
0.23% |
2.52% |
9.23 |
|
| People in Multi-Ethnic, Low-Income Areas |
0.00% |
2.10% |
0.00 |
|
| Unclassified |
0.00% |
0.06% |
0.00 |
|
|
 |
 |
 |
| £0-5K |
11.43% |
9.41% |
121.39 |
|
| £5-10K |
20.63% |
16.63% |
124.06 |
|
| £10-15K |
19.55% |
16.58% |
117.90 |
|
| £15-20K |
14.83% |
13.58% |
109.17 |
|
| £20-25K |
10.38% |
10.39% |
99.88 |
|
| £25-30K |
7.07% |
7.77% |
90.92 |
|
| £30-35K |
4.79% |
5.79% |
82.69 |
|
| £35-40K |
3.26% |
4.33% |
75.31 |
|
| £40-45K |
2.25% |
3.27% |
68.79 |
|
| £45-50K |
1.56% |
2.48% |
63.05 |
|
| £50-55K |
1.10% |
1.90% |
58.01 |
|
| £55-60K |
0.79% |
1.47% |
53.58 |
|
| £60-65K |
0.57% |
1.15% |
49.68 |
|
| £65-70K |
0.42% |
0.91% |
46.23 |
|
| £70-75K |
0.31% |
0.72% |
43.17 |
|
| £75-80K |
0.23% |
0.57% |
40.45 |
|
| £80-85K |
0.18% |
0.46% |
38.02 |
|
| £85-90K |
0.13% |
0.37% |
35.83 |
|
| £90-95K |
0.10% |
0.31% |
33.86 |
|
| £95-100K |
0.08% |
0.25% |
32.08 |
|
| £100K + |
0.33% |
1.34% |
24.30 |
|
|
|

|


|
1992-1997
|
1997-2001
|
|
|
|
| Con |
-9.69% |
| Lab |
13.64% |
| LD |
-3.55% |
|
| Con |
-1.42% |
| Lab |
-2.75% |
| LD |
2.05% |
|
|
 |
Gordon Marsden
Labour hold
|
| Con |
 |
12,798 |
32.99% |
| Lab |
 |
21,060 |
54.29% |
| LD |
 |
4,115 |
10.61% |
| Oth |
 |
819 |
2.11% |
| Maj |
 |
8,262 |
21.30% |
| Turn |
 |
38,792 |
52.20% |
|
|
 |
Gordon Marsden
Labour hold
|
| UK |
Val Cowell |
819 |
2.11% |
| LD |
Doreen Holt |
4,115 |
10.61% |
| L |
Gordon Marsden |
21,060 |
54.29% |
| C |
David Morris |
12,798 |
32.99% |
|
Candidates representing 4 parties stood for election to this seat.
|
|
 |
Gordon Marsden
Labour gain
|
| Con |
 |
17,666 |
34.41% |
| Lab |
 |
29,282 |
57.04% |
| LD |
 |
4,392 |
8.55% |
| Ref |
|
0 |
0.00% |
| Oth |
|
0 |
0.00% |
| Maj |
 |
11,616 |
22.63% |
| Turn |
 |
51,340 |
67.80% |
|
|
 |
|
Conservative
|
| Con |
 |
25,957 |
44.10% |
| Lab |
 |
25,563 |
43.40% |
| LD |
 |
7,148 |
12.10% |
| Oth |
 |
233 |
0.40% |
| Maj |
 |
394 |
0.70% |
| Turn |
 |
58,901 |
78.53% |
|
|
 |
|

|

