|
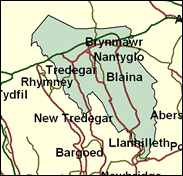
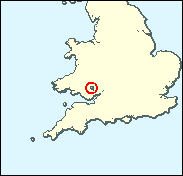
Blaenau Gwent
Labour hold

Unlike such other South Welsh valley constituencies, such as Islwyn, Rhondda and Llanelli, Michael Foot's former seat resisted the temptation to spring a shock by electing a Plaid Cymru representative in the 1999 Welsh Assembly elections. With a full General Election turnout, it is likely once more to return a Labour MP with a very substantial majority here in the uplands ("blaenau") of the former county of Gwent or Monmouthshire.

Stocky, trim-bearded Walter Ulbricht look-alike, Llew Smith, elected here in 1992, is the less famous, but equally rebellious successor to two Labour icons: Aneurin Bevan and Michael Foot. Born 1944 and educated at Greenfield Secondary Modern School, Newbridge and - via Coleg Harlech - Cardiff University he worked as a labourer at Pilkington Glass and George Wimpeys, before following Neil Kinnock as South Wales WEA organiser and being MEP for SE Wales for ten years. An unbending Campaign Grouper he has missed none of the major rebellions against the Blair government from lone parent benefit cuts to air traffic control privatisation, and publicly fell out with the leadership over his opposition to Welsh devolution. In opposition he also opposed Blair on Clause Four.

 |
| Wealthy Achievers, Suburban Areas |
0.19% |
14.99% |
1.24 |
|
| Affluent Greys, Rural Communities |
0.00% |
2.13% |
0.00 |
|
| Prosperous Pensioners, Retirement Areas |
0.10% |
2.49% |
4.11 |
|
| Affluent Executives, Family Areas |
0.04% |
4.43% |
0.95 |
|
| Well-Off Workers, Family Areas |
2.06% |
7.27% |
28.30 |
|
| Affluent Urbanites, Town & City Areas |
0.00% |
2.56% |
0.00 |
|
| Prosperous Professionals, Metropolitan Areas |
0.00% |
2.04% |
0.00 |
|
| Better-Off Executives, Inner City Areas |
0.00% |
3.94% |
0.00 |
|
| Comfortable Middle Agers, Mature Home Owning Areas |
0.30% |
13.04% |
2.28 |
|
| Skilled Workers, Home Owning Areas |
46.80% |
12.70% |
368.46 |
|
| New Home Owners, Mature Communities |
17.28% |
8.14% |
212.16 |
|
| White Collar Workers, Better-Off Multi Ethnic Areas |
0.18% |
4.02% |
4.55 |
|
| Older People, Less Prosperous Areas |
6.66% |
3.19% |
209.22 |
|
| Council Estate Residents, Better-Off Homes |
15.77% |
11.31% |
139.42 |
|
| Council Estate Residents, High Unemployment |
0.56% |
3.06% |
18.22 |
|
| Council Estate Residents, Greatest Hardship |
10.06% |
2.52% |
399.37 |
|
| People in Multi-Ethnic, Low-Income Areas |
0.00% |
2.10% |
0.00 |
|
| Unclassified |
0.00% |
0.06% |
0.00 |
|
|
 |
|
|
| £0-5K |
14.85% |
9.41% |
157.79 |
|
| £5-10K |
24.14% |
16.63% |
145.11 |
|
| £10-15K |
20.56% |
16.58% |
124.02 |
|
| £15-20K |
14.10% |
13.58% |
103.81 |
|
| £20-25K |
9.01% |
10.39% |
86.68 |
|
| £25-30K |
5.66% |
7.77% |
72.75 |
|
| £30-35K |
3.56% |
5.79% |
61.54 |
|
| £35-40K |
2.28% |
4.33% |
52.53 |
|
| £40-45K |
1.48% |
3.27% |
45.24 |
|
| £45-50K |
0.98% |
2.48% |
39.31 |
|
| £50-55K |
0.66% |
1.90% |
34.43 |
|
| £55-60K |
0.45% |
1.47% |
30.39 |
|
| £60-65K |
0.31% |
1.15% |
27.01 |
|
| £65-70K |
0.22% |
0.91% |
24.16 |
|
| £70-75K |
0.16% |
0.72% |
21.74 |
|
| £75-80K |
0.11% |
0.57% |
19.67 |
|
| £80-85K |
0.08% |
0.46% |
17.88 |
|
| £85-90K |
0.06% |
0.37% |
16.33 |
|
| £90-95K |
0.05% |
0.31% |
14.97 |
|
| £95-100K |
0.03% |
0.25% |
13.78 |
|
| £100K + |
0.12% |
1.34% |
9.18 |
|
|
|
|


|
1992-1997
|
1997-2001
|
|
|
|
| Con |
-3.22% |
| Lab |
0.47% |
| LD |
2.33% |
| PC |
0.43% |
|
| Con |
0.93% |
| Lab |
-7.43% |
| LD |
0.56% |
| PC |
5.94% |
|
|
|
Llew Smith
Labour hold
|
| Con |
 |
2,383 |
7.51% |
| Lab |
 |
22,855 |
72.04% |
| LD |
 |
2,945 |
9.28% |
| PC |
 |
3,542 |
11.16% |
| Oth |
|
0 |
0.00% |
| Maj |
 |
19,313 |
60.88% |
| Turn |
|
31,725 |
59.46% |
|
|
|
Llew Smith
Labour hold
|
| PC |
Adam Rykala |
3,542 |
11.16% |
| L |
Llew Smith |
22,855 |
72.04% |
| LD |
Edward Townsend |
2,945 |
9.28% |
| C |
Hugh Williams |
2,383 |
7.51% |
|
Candidates representing 4 parties stood for election to this seat.
|
|
|
Llew Smith
Labour
|
| Con |
|
2,607 |
6.58% |
| Lab |
|
31,493 |
79.47% |
| LD |
|
3,458 |
8.73% |
| PC |
|
2,072 |
5.23% |
| Ref |
|
0 |
0.00% |
| Oth |
|
0 |
0.00% |
| Maj |
|
28,035 |
70.74% |
| Turn |
|
39,630 |
72.32% |
|
|
|
|
Labour
|
| Con |
|
4,266 |
9.80% |
| Lab |
|
34,333 |
79.00% |
| LD |
|
2,774 |
6.40% |
| PC |
|
2,099 |
4.80% |
| Oth |
|
0 |
0.00% |
| Maj |
|
30,067 |
69.20% |
| Turn |
|
43,472 |
77.39% |
|
|
|
|
|