|
Blaydon
Labour hold

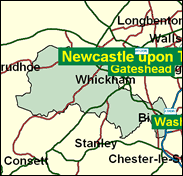
Although technically included in Tyne and Wear and in Gateshead Borough, this is a County Durham seat which fits the picture of a working class corner of the land steeped in Labour party tradition and with a long and untroubled history of representation. The Liberal Democrat local activity, for example in Whickham and Ryton, surfaced perceptibly in 1997 with a slight increase in the share of the vote and an advance into second place, but this scarcely impacted on the huge lead of John McWilliam, who was not elected Speaker three years later.

John McWilliam, one of a score of Labour Scots in English seats, was elected here in 1979. Born 1941, educated at Leith Academy, Heriot Watt and Napier Colleges, and a former telephone engineer, he was a whip for three years in the eighties before disappearing into the obscurity of committee chairmanships. Cocky and loquacious he is a soft Eurosceptic who introduced a Bill to tighten rules on phone tapping and defends defence industry jobs.

 |
| Wealthy Achievers, Suburban Areas |
5.05% |
14.99% |
33.65 |
|
| Affluent Greys, Rural Communities |
0.00% |
2.13% |
0.00 |
|
| Prosperous Pensioners, Retirement Areas |
0.59% |
2.49% |
23.56 |
|
| Affluent Executives, Family Areas |
3.85% |
4.43% |
87.06 |
|
| Well-Off Workers, Family Areas |
13.75% |
7.27% |
189.09 |
|
| Affluent Urbanites, Town & City Areas |
0.09% |
2.56% |
3.56 |
|
| Prosperous Professionals, Metropolitan Areas |
0.00% |
2.04% |
0.00 |
|
| Better-Off Executives, Inner City Areas |
0.18% |
3.94% |
4.48 |
|
| Comfortable Middle Agers, Mature Home Owning Areas |
14.59% |
13.04% |
111.93 |
|
| Skilled Workers, Home Owning Areas |
20.88% |
12.70% |
164.41 |
|
| New Home Owners, Mature Communities |
14.02% |
8.14% |
172.18 |
|
| White Collar Workers, Better-Off Multi Ethnic Areas |
0.19% |
4.02% |
4.78 |
|
| Older People, Less Prosperous Areas |
7.32% |
3.19% |
229.77 |
|
| Council Estate Residents, Better-Off Homes |
15.63% |
11.31% |
138.23 |
|
| Council Estate Residents, High Unemployment |
0.96% |
3.06% |
31.22 |
|
| Council Estate Residents, Greatest Hardship |
2.89% |
2.52% |
114.83 |
|
| People in Multi-Ethnic, Low-Income Areas |
0.00% |
2.10% |
0.00 |
|
| Unclassified |
0.00% |
0.06% |
0.00 |
|
|
 |
 |
 |
| £0-5K |
10.77% |
9.41% |
114.36 |
|
| £5-10K |
19.08% |
16.63% |
114.74 |
|
| £10-15K |
18.35% |
16.58% |
110.66 |
|
| £15-20K |
14.38% |
13.58% |
105.87 |
|
| £20-25K |
10.48% |
10.39% |
100.84 |
|
| £25-30K |
7.44% |
7.77% |
95.76 |
|
| £30-35K |
5.26% |
5.79% |
90.80 |
|
| £35-40K |
3.73% |
4.33% |
86.07 |
|
| £40-45K |
2.67% |
3.27% |
81.63 |
|
| £45-50K |
1.92% |
2.48% |
77.51 |
|
| £50-55K |
1.40% |
1.90% |
73.72 |
|
| £55-60K |
1.04% |
1.47% |
70.23 |
|
| £60-65K |
0.77% |
1.15% |
67.02 |
|
| £65-70K |
0.58% |
0.91% |
64.08 |
|
| £70-75K |
0.44% |
0.72% |
61.37 |
|
| £75-80K |
0.34% |
0.57% |
58.86 |
|
| £80-85K |
0.26% |
0.46% |
56.54 |
|
| £85-90K |
0.20% |
0.37% |
54.39 |
|
| £90-95K |
0.16% |
0.31% |
52.39 |
|
| £95-100K |
0.13% |
0.25% |
50.52 |
|
| £100K + |
0.55% |
1.34% |
41.12 |
|
|
|

|


|
1992-1997
|
1997-2001
|
|
|
|
| Con |
-13.53% |
| Lab |
7.26% |
| LD |
3.10% |
|
| Con |
-1.80% |
| Lab |
-5.11% |
| LD |
9.99% |
|
|
 |
John McWilliam
Labour hold
|
| Con |
 |
4,215 |
11.37% |
| Lab |
 |
20,340 |
54.85% |
| LD |
 |
12,531 |
33.79% |
| Oth |
|
0 |
0.00% |
| Maj |
 |
7,809 |
21.06% |
| Turn |
 |
37,086 |
57.43% |
|
|
 |
John McWilliam
Labour hold
|
| LD |
Peter Maughan |
12,531 |
33.79% |
| L |
John McWilliam |
20,340 |
54.85% |
| C |
Mark Watson |
4,215 |
11.37% |
|
Candidates representing 3 parties stood for election to this seat.
|
|
 |
John McWilliam
Labour
|
| Con |
 |
6,048 |
13.17% |
| Lab |
 |
27,535 |
59.96% |
| LD |
 |
10,930 |
23.80% |
| Ref |
|
0 |
0.00% |
| Oth |
 |
1,412 |
3.07% |
| Maj |
 |
16,605 |
36.16% |
| Turn |
 |
45,925 |
70.98% |
|
|
 |
|
Labour
|
| Con |
 |
13,685 |
26.70% |
| Lab |
 |
27,028 |
52.70% |
| LD |
 |
10,602 |
20.70% |
| Oth |
|
0 |
0.00% |
| Maj |
 |
13,343 |
26.00% |
| Turn |
 |
51,315 |
76.82% |
|
|
 |
|

|

