|
Blyth Valley
Labour hold

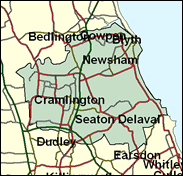
Although this seat in the heavily populated south eastern corner of Northumberland looks the part of a Labour stronghold, it experienced an individual electoral history , to say the least, in the last quarter of the twentieth century. After dropping their independently minded MP Eddie Milne for the February 1974 election, Labour entered a long troubled period. Milne beat the official candidate in that contest, then lost narrowly in October 1974 and 1979. He died before the 1983 election, but instead Labour's highly eccentric John Ryman (an active fox hunter with some rather wild opinions) faced another strong challenge in the shape of the newly formed SDP. Things got no easier in 1987, when Ryman was replaced by a far left wing Labour standard bearer, Ronnie Campbell; the SDP lost by only 853 votes. After the disappearance of the SDP into the Liberal Democrats, Labour's position has become much stronger, and by 1997 Campbell had a majority of nearly 18,000, after a huge swing - here from the LDs, not the Tories, who have been bystanders throughout this mayhem. One cannot but feel that Labour have brought these troubles on themselves. Blyth itself is one of those far northern towns of remorselessly gritty aspect, with its seafront overshadowed by a power station, docks and the legacy of mining. There are old colliery villages like Seghill. Finally, a more volatile voting pattern might be expected in the "New Town" of Cramlington, still quite working class but less traditionally rooted. Cramlington was still in the 1999 local elections the site of the majority of the nine Liberal Democrats on Blyth Valley council, but they have never provided the threat that Eddie Milne and then the SDP did.

In 1918 the Parliamentary Labour Party was dubbed “a committee of checkweighmen”, nearly half of them (25 out of 57) being miners. By 1997 in a PLP of 418 the total was 12 (ex-miners or NUM officials) and of those 12 collectors' items one is Ronnie Campbell, MP here since 1987. Facially birthmarked and with a Geordie accent that makes Gazza sound like Brian Sewell, he was born 1943, and after secondary modern schooling was a miner for 27 years until made redundant a year before he became an MP. He fairly regularly rebels with other Campaign Groupers, his belligerent verbal outbursts symbolising the eclipse of a proletarian culture and the mining industry's terminal decay.

 |
| Wealthy Achievers, Suburban Areas |
1.28% |
14.99% |
8.51 |
|
| Affluent Greys, Rural Communities |
0.00% |
2.13% |
0.00 |
|
| Prosperous Pensioners, Retirement Areas |
0.12% |
2.49% |
4.86 |
|
| Affluent Executives, Family Areas |
7.03% |
4.43% |
158.84 |
|
| Well-Off Workers, Family Areas |
22.57% |
7.27% |
310.26 |
|
| Affluent Urbanites, Town & City Areas |
3.09% |
2.56% |
120.44 |
|
| Prosperous Professionals, Metropolitan Areas |
0.00% |
2.04% |
0.00 |
|
| Better-Off Executives, Inner City Areas |
0.00% |
3.94% |
0.00 |
|
| Comfortable Middle Agers, Mature Home Owning Areas |
5.18% |
13.04% |
39.72 |
|
| Skilled Workers, Home Owning Areas |
15.24% |
12.70% |
119.98 |
|
| New Home Owners, Mature Communities |
16.53% |
8.14% |
203.01 |
|
| White Collar Workers, Better-Off Multi Ethnic Areas |
0.94% |
4.02% |
23.33 |
|
| Older People, Less Prosperous Areas |
7.82% |
3.19% |
245.53 |
|
| Council Estate Residents, Better-Off Homes |
15.27% |
11.31% |
134.99 |
|
| Council Estate Residents, High Unemployment |
0.95% |
3.06% |
31.01 |
|
| Council Estate Residents, Greatest Hardship |
3.99% |
2.52% |
158.42 |
|
| People in Multi-Ethnic, Low-Income Areas |
0.00% |
2.10% |
0.00 |
|
| Unclassified |
0.00% |
0.06% |
0.00 |
|
|
 |
 |
 |
| £0-5K |
11.11% |
9.41% |
118.06 |
|
| £5-10K |
20.20% |
16.63% |
121.47 |
|
| £10-15K |
19.14% |
16.58% |
115.47 |
|
| £15-20K |
14.56% |
13.58% |
107.21 |
|
| £20-25K |
10.28% |
10.39% |
98.91 |
|
| £25-30K |
7.09% |
7.77% |
91.24 |
|
| £30-35K |
4.88% |
5.79% |
84.34 |
|
| £35-40K |
3.39% |
4.33% |
78.18 |
|
| £40-45K |
2.37% |
3.27% |
72.71 |
|
| £45-50K |
1.68% |
2.48% |
67.84 |
|
| £50-55K |
1.21% |
1.90% |
63.51 |
|
| £55-60K |
0.88% |
1.47% |
59.65 |
|
| £60-65K |
0.65% |
1.15% |
56.20 |
|
| £65-70K |
0.48% |
0.91% |
53.10 |
|
| £70-75K |
0.36% |
0.72% |
50.31 |
|
| £75-80K |
0.27% |
0.57% |
47.79 |
|
| £80-85K |
0.21% |
0.46% |
45.51 |
|
| £85-90K |
0.16% |
0.37% |
43.43 |
|
| £90-95K |
0.13% |
0.31% |
41.53 |
|
| £95-100K |
0.10% |
0.25% |
39.80 |
|
| £100K + |
0.43% |
1.34% |
31.80 |
|
|
|

|


|
1992-1997
|
1997-2001
|
|
|
|
| Con |
-2.26% |
| Lab |
14.31% |
| LD |
-11.04% |
|
| Con |
2.54% |
| Lab |
-4.50% |
| LD |
1.97% |
|
|
 |
Ronnie Campbell
Labour hold
|
| Con |
 |
5,484 |
15.87% |
| Lab |
 |
20,627 |
59.70% |
| LD |
 |
8,439 |
24.43% |
| Oth |
|
0 |
0.00% |
| Maj |
 |
12,188 |
35.28% |
| Turn |
 |
34,550 |
54.60% |
|
|
 |
Ronnie Campbell
Labour hold
|
| L |
Ronnie Campbell |
20,627 |
59.70% |
| C |
Wayne Daley |
5,484 |
15.87% |
| LD |
Jeff Reid |
8,439 |
24.43% |
|
Candidates representing 3 parties stood for election to this seat.
|
|
 |
Ronnie Campbell
Labour
|
| Con |
 |
5,666 |
13.34% |
| Lab |
 |
27,276 |
64.21% |
| LD |
 |
9,540 |
22.46% |
| Ref |
|
0 |
0.00% |
| Oth |
|
0 |
0.00% |
| Maj |
 |
17,736 |
41.75% |
| Turn |
 |
42,482 |
68.78% |
|
|
 |
|
Labour
|
| Con |
 |
7,691 |
15.60% |
| Lab |
 |
24,542 |
49.90% |
| LD |
 |
16,498 |
33.50% |
| Oth |
 |
470 |
1.00% |
| Maj |
 |
8,044 |
16.30% |
| Turn |
 |
49,201 |
80.25% |
|
|
 |
|

|

