|
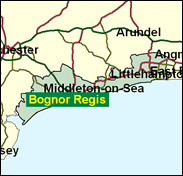
Bognor Regis & Littlehampton
Conservative hold

One of a chain of safe Tory seats on the West Sussex coast, Labour could increase their share by fully 15pc in 1997 and win some council seats in Littlehampton itself, which has light industry, but even this would barely take them into a distant second place. The Sussex coast, apart from the Brighton Kempton and Pavilion constituencies, is scarcely known for a radical view of the world. The main town here is probably doomed to be forever asscociated with the alleged dying words of King George V which are scarcely complimentary. But it is Labour and Liberal Democrats who have cause to mutter, under their breath and discreetly, "bugger Bognor . . .".

Nick Gibb won this new seat for the Conservatives in 1997. A Trade n 1946 and educated at Derby Grammar School, Bury, he has concentrated on the local issues of jobs, crime and education.

 |
| Wealthy Achievers, Suburban Areas |
12.30% |
14.99% |
82.03 |
|
| Affluent Greys, Rural Communities |
0.40% |
2.13% |
18.93 |
|
| Prosperous Pensioners, Retirement Areas |
24.06% |
2.49% |
967.89 |
|
| Affluent Executives, Family Areas |
1.98% |
4.43% |
44.71 |
|
| Well-Off Workers, Family Areas |
2.01% |
7.27% |
27.69 |
|
| Affluent Urbanites, Town & City Areas |
0.00% |
2.56% |
0.00 |
|
| Prosperous Professionals, Metropolitan Areas |
0.00% |
2.04% |
0.00 |
|
| Better-Off Executives, Inner City Areas |
7.96% |
3.94% |
201.94 |
|
| Comfortable Middle Agers, Mature Home Owning Areas |
15.37% |
13.04% |
117.91 |
|
| Skilled Workers, Home Owning Areas |
15.48% |
12.70% |
121.87 |
|
| New Home Owners, Mature Communities |
8.41% |
8.14% |
103.29 |
|
| White Collar Workers, Better-Off Multi Ethnic Areas |
2.69% |
4.02% |
67.01 |
|
| Older People, Less Prosperous Areas |
2.50% |
3.19% |
78.54 |
|
| Council Estate Residents, Better-Off Homes |
4.98% |
11.31% |
44.04 |
|
| Council Estate Residents, High Unemployment |
0.97% |
3.06% |
31.77 |
|
| Council Estate Residents, Greatest Hardship |
0.86% |
2.52% |
34.19 |
|
| People in Multi-Ethnic, Low-Income Areas |
0.00% |
2.10% |
0.00 |
|
| Unclassified |
0.00% |
0.06% |
0.00 |
|
|
 |
 |
 |
| £0-5K |
10.34% |
9.41% |
109.83 |
|
| £5-10K |
18.40% |
16.63% |
110.64 |
|
| £10-15K |
18.01% |
16.58% |
108.65 |
|
| £15-20K |
14.27% |
13.58% |
105.07 |
|
| £20-25K |
10.48% |
10.39% |
100.85 |
|
| £25-30K |
7.50% |
7.77% |
96.51 |
|
| £30-35K |
5.35% |
5.79% |
92.33 |
|
| £35-40K |
3.83% |
4.33% |
88.44 |
|
| £40-45K |
2.77% |
3.27% |
84.87 |
|
| £45-50K |
2.03% |
2.48% |
81.62 |
|
| £50-55K |
1.50% |
1.90% |
78.67 |
|
| £55-60K |
1.12% |
1.47% |
76.00 |
|
| £60-65K |
0.85% |
1.15% |
73.58 |
|
| £65-70K |
0.65% |
0.91% |
71.37 |
|
| £70-75K |
0.50% |
0.72% |
69.36 |
|
| £75-80K |
0.39% |
0.57% |
67.52 |
|
| £80-85K |
0.30% |
0.46% |
65.82 |
|
| £85-90K |
0.24% |
0.37% |
64.26 |
|
| £90-95K |
0.19% |
0.31% |
62.82 |
|
| £95-100K |
0.15% |
0.25% |
61.48 |
|
| £100K + |
0.74% |
1.34% |
54.77 |
|
|
|

|


|
1992-1997
|
1997-2001
|
|
|
|
| Con |
-12.68% |
| Lab |
14.96% |
| LD |
-2.69% |
|
| Con |
0.95% |
| Lab |
2.23% |
| LD |
-6.45% |
|
|
 |
Nick Gibb
Conservative hold
|
| Con |
 |
17,602 |
45.17% |
| Lab |
 |
11,959 |
30.69% |
| LD |
 |
6,846 |
17.57% |
| Oth |
 |
2,561 |
6.57% |
| Maj |
 |
5,643 |
14.48% |
| Turn |
 |
38,968 |
58.25% |
|
|
 |
Nick Gibb
Conservative hold
|
| C |
Nick Gibb |
17,602 |
45.17% |
| L |
George O'Neill |
11,959 |
30.69% |
| LD |
Pamela Peskett |
6,846 |
17.57% |
| G |
Lilias Rider Haggard Cheyne |
782 |
2.01% |
| UK |
George Stride |
1,779 |
4.57% |
|
Candidates representing 5 parties stood for election to this seat.
|
|
 |
Nick Gibb
Conservative
|
| Con |
 |
20,537 |
44.22% |
| Lab |
 |
13,216 |
28.46% |
| LD |
 |
11,153 |
24.01% |
| Ref |
|
0 |
0.00% |
| Oth |
 |
1,537 |
3.31% |
| Maj |
 |
7,321 |
15.76% |
| Turn |
 |
46,443 |
69.86% |
|
|
 |
|
Conservative
|
| Con |
 |
28,316 |
56.90% |
| Lab |
 |
6,700 |
13.50% |
| LD |
 |
13,309 |
26.70% |
| Oth |
 |
1,474 |
3.00% |
| Maj |
 |
15,007 |
30.10% |
| Turn |
 |
49,799 |
75.95% |
|
|
 |
|

|

