|
Bolton North East
Labour hold

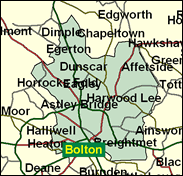
The Conservatives pipped Labour by just two per cent in the 1999 Euro-elections within Bolton North East, but this was on a turnout of less than 20pc. In the 2000 local elections, with a slightly higher turnout, the Conservatives kept their noses in front and must be regarded as genuine challengers for the next General. This is a genuinely marginal seat, with a mixture of wards in a town which has always seen competitive electoral contests. Bolton North East stretches from Labour supporting inner terraces at Central and Tonge, to peripheral council housing at Breightmet, and attractive middle class owner occupied residential areas in the north at Bradshaw and Bromley Cross. The contrasts are stark: at the last census, for example, 35pc of the population in Central ward was non-white and 33pc of households owned a car; in Bradshaw the figures were 1 per cent and 76pc respectively. It all adds up to a question of which aspect will predominate on the crucial day.

David Crausby, a rare blue collar worker in Labour's 1997 intake sank into the green leather benches as a low-profile loyalist. A dark and sallow complexioned engineer born 1946 and educated at Derby Grammar School, Bury, he has concentrated on the local issues of jobs, crime and education.

 |
| Wealthy Achievers, Suburban Areas |
11.21% |
14.99% |
74.74 |
|
| Affluent Greys, Rural Communities |
0.00% |
2.13% |
0.10 |
|
| Prosperous Pensioners, Retirement Areas |
0.07% |
2.49% |
2.92 |
|
| Affluent Executives, Family Areas |
5.64% |
4.43% |
127.53 |
|
| Well-Off Workers, Family Areas |
10.16% |
7.27% |
139.67 |
|
| Affluent Urbanites, Town & City Areas |
0.71% |
2.56% |
27.63 |
|
| Prosperous Professionals, Metropolitan Areas |
0.21% |
2.04% |
10.12 |
|
| Better-Off Executives, Inner City Areas |
0.05% |
3.94% |
1.25 |
|
| Comfortable Middle Agers, Mature Home Owning Areas |
13.31% |
13.04% |
102.11 |
|
| Skilled Workers, Home Owning Areas |
20.37% |
12.70% |
160.33 |
|
| New Home Owners, Mature Communities |
2.93% |
8.14% |
35.93 |
|
| White Collar Workers, Better-Off Multi Ethnic Areas |
0.32% |
4.02% |
7.84 |
|
| Older People, Less Prosperous Areas |
6.05% |
3.19% |
189.85 |
|
| Council Estate Residents, Better-Off Homes |
17.47% |
11.31% |
154.42 |
|
| Council Estate Residents, High Unemployment |
2.79% |
3.06% |
91.05 |
|
| Council Estate Residents, Greatest Hardship |
6.52% |
2.52% |
258.96 |
|
| People in Multi-Ethnic, Low-Income Areas |
2.20% |
2.10% |
104.99 |
|
| Unclassified |
0.00% |
0.06% |
3.52 |
|
|
 |
 |
 |
| £0-5K |
11.82% |
9.41% |
125.52 |
|
| £5-10K |
19.45% |
16.63% |
116.91 |
|
| £10-15K |
17.87% |
16.58% |
107.76 |
|
| £15-20K |
13.71% |
13.58% |
100.95 |
|
| £20-25K |
9.96% |
10.39% |
95.88 |
|
| £25-30K |
7.14% |
7.77% |
91.86 |
|
| £30-35K |
5.13% |
5.79% |
88.49 |
|
| £35-40K |
3.70% |
4.33% |
85.50 |
|
| £40-45K |
2.70% |
3.27% |
82.76 |
|
| £45-50K |
1.99% |
2.48% |
80.20 |
|
| £50-55K |
1.48% |
1.90% |
77.78 |
|
| £55-60K |
1.11% |
1.47% |
75.48 |
|
| £60-65K |
0.84% |
1.15% |
73.27 |
|
| £65-70K |
0.65% |
0.91% |
71.16 |
|
| £70-75K |
0.50% |
0.72% |
69.14 |
|
| £75-80K |
0.39% |
0.57% |
67.20 |
|
| £80-85K |
0.30% |
0.46% |
65.34 |
|
| £85-90K |
0.24% |
0.37% |
63.56 |
|
| £90-95K |
0.19% |
0.31% |
61.85 |
|
| £95-100K |
0.15% |
0.25% |
60.22 |
|
| £100K + |
0.69% |
1.34% |
51.09 |
|
|
|

|


|
1992-1997
|
1997-2001
|
|
|
|
| Con |
-11.71% |
| Lab |
8.63% |
| LD |
-0.22% |
|
| Con |
2.33% |
| Lab |
-1.79% |
| LD |
0.40% |
|
|
 |
David Crausby
Labour hold
|
| Con |
 |
12,744 |
32.72% |
| Lab |
 |
21,166 |
54.34% |
| LD |
 |
4,004 |
10.28% |
| Oth |
 |
1,036 |
2.66% |
| Maj |
 |
8,422 |
21.62% |
| Turn |
 |
38,950 |
56.03% |
|
|
 |
David Crausby
Labour hold
|
| L |
David Crausby |
21,166 |
54.34% |
| SL |
Lynne Lowe |
407 |
1.04% |
| G |
Kenneth McIvor |
629 |
1.61% |
| LD |
Tim Perkins |
4,004 |
10.28% |
| C |
Michael Winstanley |
12,744 |
32.72% |
|
Candidates representing 5 parties stood for election to this seat.
|
|
 |
David Crausby
Labour
|
| Con |
 |
14,952 |
30.39% |
| Lab |
 |
27,621 |
56.13% |
| LD |
 |
4,862 |
9.88% |
| Ref |
 |
1,096 |
2.23% |
| Oth |
 |
676 |
1.37% |
| Maj |
 |
12,669 |
25.75% |
| Turn |
 |
49,207 |
72.44% |
|
|
 |
|
Labour
|
| Con |
 |
23,477 |
42.10% |
| Lab |
 |
26,494 |
47.50% |
| LD |
 |
5,638 |
10.10% |
| Oth |
 |
213 |
0.40% |
| Maj |
 |
3,017 |
5.40% |
| Turn |
 |
55,822 |
80.06% |
|
|
 |
|

|

