|
Bolton South East
Labour hold

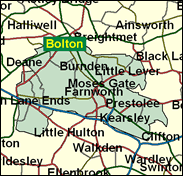
The one really safe seat in Bolton Borough contains the smallest population from the town itself, although it reaches the "inner city" in Derby and Burnden wards. The seat also contains the separate communities of Farnworth, Kearsley and Little Lever, but these demonstrate Labour sympathies too, Although Labour lost two wards in their rather poor year (for recent times) of 2000, including Derby to an Asian Conservative, Brian Iddon has nothing electoral to fear.

Dr Brian Iddon, a former Salford University chemistry lecturer, born 1940, held the seat for Labour in 1997 as the replacement for the deselected MP David Young, and soon built a reputation as a campaigner for cannabis decriminalisation. Coming late to the Commons (at 56) and with a shopping list of utilities he wanted to renationalise, he has settled for a limited portfolio of rebellions on lone parent benefit cuts, disability benefit cuts, and the linking of pensions to average earnings.

 |
| Wealthy Achievers, Suburban Areas |
0.83% |
14.99% |
5.57 |
|
| Affluent Greys, Rural Communities |
0.00% |
2.13% |
0.00 |
|
| Prosperous Pensioners, Retirement Areas |
0.00% |
2.49% |
0.00 |
|
| Affluent Executives, Family Areas |
0.01% |
4.43% |
0.25 |
|
| Well-Off Workers, Family Areas |
11.61% |
7.27% |
159.63 |
|
| Affluent Urbanites, Town & City Areas |
0.41% |
2.56% |
15.80 |
|
| Prosperous Professionals, Metropolitan Areas |
0.00% |
2.04% |
0.00 |
|
| Better-Off Executives, Inner City Areas |
1.43% |
3.94% |
36.21 |
|
| Comfortable Middle Agers, Mature Home Owning Areas |
3.89% |
13.04% |
29.81 |
|
| Skilled Workers, Home Owning Areas |
26.98% |
12.70% |
212.37 |
|
| New Home Owners, Mature Communities |
12.33% |
8.14% |
151.41 |
|
| White Collar Workers, Better-Off Multi Ethnic Areas |
0.59% |
4.02% |
14.69 |
|
| Older People, Less Prosperous Areas |
4.88% |
3.19% |
153.32 |
|
| Council Estate Residents, Better-Off Homes |
27.00% |
11.31% |
238.75 |
|
| Council Estate Residents, High Unemployment |
2.34% |
3.06% |
76.39 |
|
| Council Estate Residents, Greatest Hardship |
3.57% |
2.52% |
141.69 |
|
| People in Multi-Ethnic, Low-Income Areas |
4.13% |
2.10% |
196.64 |
|
| Unclassified |
0.00% |
0.06% |
0.00 |
|
|
 |
 |
 |
| £0-5K |
11.78% |
9.41% |
125.13 |
|
| £5-10K |
21.36% |
16.63% |
128.42 |
|
| £10-15K |
19.88% |
16.58% |
119.91 |
|
| £15-20K |
14.76% |
13.58% |
108.69 |
|
| £20-25K |
10.14% |
10.39% |
97.58 |
|
| £25-30K |
6.80% |
7.77% |
87.52 |
|
| £30-35K |
4.56% |
5.79% |
78.73 |
|
| £35-40K |
3.08% |
4.33% |
71.17 |
|
| £40-45K |
2.11% |
3.27% |
64.70 |
|
| £45-50K |
1.47% |
2.48% |
59.16 |
|
| £50-55K |
1.04% |
1.90% |
54.39 |
|
| £55-60K |
0.74% |
1.47% |
50.28 |
|
| £60-65K |
0.54% |
1.15% |
46.70 |
|
| £65-70K |
0.40% |
0.91% |
43.58 |
|
| £70-75K |
0.29% |
0.72% |
40.83 |
|
| £75-80K |
0.22% |
0.57% |
38.40 |
|
| £80-85K |
0.17% |
0.46% |
36.24 |
|
| £85-90K |
0.13% |
0.37% |
34.30 |
|
| £90-95K |
0.10% |
0.31% |
32.56 |
|
| £95-100K |
0.08% |
0.25% |
30.98 |
|
| £100K + |
0.32% |
1.34% |
24.02 |
|
|
|

|


|
1992-1997
|
1997-2001
|
|
|
|
| Con |
-8.99% |
| Lab |
14.57% |
| LD |
-1.82% |
|
| Con |
4.47% |
| Lab |
-7.01% |
| LD |
2.76% |
|
|
 |
Brian Iddon
Labour hold
|
| Con |
 |
8,258 |
24.18% |
| Lab |
 |
21,129 |
61.86% |
| LD |
 |
3,941 |
11.54% |
| Oth |
 |
826 |
2.42% |
| Maj |
 |
12,871 |
37.69% |
| Turn |
 |
34,154 |
50.12% |
|
|
 |
Brian Iddon
Labour hold
|
| LD |
Frank Harasiwka |
3,941 |
11.54% |
| L |
Brian Iddon |
21,129 |
61.86% |
| SL |
William John Kelly |
826 |
2.42% |
| C |
Haroon Rashid |
8,258 |
24.18% |
|
Candidates representing 4 parties stood for election to this seat.
|
|
 |
Brian Iddon
Labour
|
| Con |
 |
8,545 |
19.71% |
| Lab |
 |
29,856 |
68.87% |
| LD |
 |
3,805 |
8.78% |
| Ref |
 |
973 |
2.24% |
| Oth |
 |
170 |
0.39% |
| Maj |
 |
21,311 |
49.16% |
| Turn |
 |
43,349 |
65.23% |
|
|
 |
|
Labour
|
| Con |
 |
14,192 |
28.70% |
| Lab |
 |
26,863 |
54.30% |
| LD |
 |
5,236 |
10.60% |
| Oth |
 |
3,181 |
6.40% |
| Maj |
 |
12,671 |
25.60% |
| Turn |
 |
49,472 |
74.32% |
|
|
 |
|

|

