|
Bolton West
Labour hold

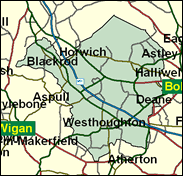
Bolton West is the Conservatives' best chance of a victory in the Pennine borough, and they polled more votes than Labour in the May 2000 local elections (when they did very well in Bolton Borough as a whole), but they still need a swing of over 7pc from the last General Election to remove Labour's young star Ruth Kelly, and in the process, Tony Blair's overall majority. The seat includes some of Bolton's best older residential areas in Deane cum Heaton and Smithills wards, and a considerable element from outside the ancient boundaries of Bolton in Hulton Park, Westhoughton, Horwich, and Blackrod. None of these elected Labour councillors in 2000, although most did in 1996. A lot will depend on whether Liberal Democrats are prepared to vote tactically to keep the Tory out in 2001, as they clearly did to get the Tory government out in 1997. This will be one of the most interesting constituencies anywhere in the country to watch.

With an attractive, somewhat androgynous look, a low-registered voice and the elitist pedigree of Westminster School, Queen's College Oxford and LSE, Ruth Kelly, a Bank of England economist and former Guardian financial journalist, was supposed to be one of the highfliers of Labour's 1997 intake. Instead she has settled, as a good Catholic, for motherhood (twice) and the small job of PPS to Nick Brown. She will have to hope she has not squandered her much-predicted ministerial opportunities as she squares up to Conservative candidate Winston Stevens, the former Tory party agent in Bolton West, with 14 years experience of election campaigning here and elsewhere. His selection is a sign of a serious Tory pitch to regain this seat.

 |
| Wealthy Achievers, Suburban Areas |
19.26% |
14.99% |
128.47 |
|
| Affluent Greys, Rural Communities |
0.00% |
2.13% |
0.00 |
|
| Prosperous Pensioners, Retirement Areas |
0.34% |
2.49% |
13.73 |
|
| Affluent Executives, Family Areas |
9.85% |
4.43% |
222.66 |
|
| Well-Off Workers, Family Areas |
14.39% |
7.27% |
197.88 |
|
| Affluent Urbanites, Town & City Areas |
0.00% |
2.56% |
0.00 |
|
| Prosperous Professionals, Metropolitan Areas |
0.05% |
2.04% |
2.47 |
|
| Better-Off Executives, Inner City Areas |
0.00% |
3.94% |
0.00 |
|
| Comfortable Middle Agers, Mature Home Owning Areas |
14.54% |
13.04% |
111.52 |
|
| Skilled Workers, Home Owning Areas |
17.86% |
12.70% |
140.63 |
|
| New Home Owners, Mature Communities |
7.46% |
8.14% |
91.66 |
|
| White Collar Workers, Better-Off Multi Ethnic Areas |
1.56% |
4.02% |
38.67 |
|
| Older People, Less Prosperous Areas |
2.43% |
3.19% |
76.24 |
|
| Council Estate Residents, Better-Off Homes |
8.96% |
11.31% |
79.20 |
|
| Council Estate Residents, High Unemployment |
0.79% |
3.06% |
25.77 |
|
| Council Estate Residents, Greatest Hardship |
2.50% |
2.52% |
99.23 |
|
| People in Multi-Ethnic, Low-Income Areas |
0.00% |
2.10% |
0.00 |
|
| Unclassified |
0.00% |
0.06% |
0.00 |
|
|
 |
 |
 |
| £0-5K |
7.71% |
9.41% |
81.91 |
|
| £5-10K |
14.29% |
16.63% |
85.89 |
|
| £10-15K |
15.32% |
16.58% |
92.41 |
|
| £15-20K |
13.40% |
13.58% |
98.65 |
|
| £20-25K |
10.82% |
10.39% |
104.08 |
|
| £25-30K |
8.45% |
7.77% |
108.64 |
|
| £30-35K |
6.51% |
5.79% |
112.39 |
|
| £35-40K |
5.00% |
4.33% |
115.43 |
|
| £40-45K |
3.85% |
3.27% |
117.85 |
|
| £45-50K |
2.97% |
2.48% |
119.75 |
|
| £50-55K |
2.31% |
1.90% |
121.20 |
|
| £55-60K |
1.80% |
1.47% |
122.28 |
|
| £60-65K |
1.42% |
1.15% |
123.05 |
|
| £65-70K |
1.12% |
0.91% |
123.55 |
|
| £70-75K |
0.89% |
0.72% |
123.84 |
|
| £75-80K |
0.71% |
0.57% |
123.94 |
|
| £80-85K |
0.57% |
0.46% |
123.88 |
|
| £85-90K |
0.46% |
0.37% |
123.69 |
|
| £90-95K |
0.38% |
0.31% |
123.40 |
|
| £95-100K |
0.31% |
0.25% |
123.01 |
|
| £100K + |
1.59% |
1.34% |
118.07 |
|
|
|

|


|
1992-1997
|
1997-2001
|
|
|
|
| Con |
-12.17% |
| Lab |
10.42% |
| LD |
-2.40% |
|
| Con |
-1.49% |
| Lab |
-2.49% |
| LD |
7.58% |
|
|
 |
Ruth Kelly
Labour hold
|
| Con |
 |
13,863 |
33.64% |
| Lab |
 |
19,381 |
47.03% |
| LD |
 |
7,573 |
18.37% |
| Oth |
 |
397 |
0.96% |
| Maj |
 |
5,518 |
13.39% |
| Turn |
 |
41,214 |
62.41% |
|
|
 |
Ruth Kelly
Labour hold
|
| L |
Ruth Kelly |
19,381 |
47.03% |
| LD |
Barbara Ronson |
7,573 |
18.37% |
| C |
James Stevens |
13,863 |
33.64% |
| SA |
David Toomer |
397 |
0.96% |
|
Candidates representing 4 parties stood for election to this seat.
|
|
 |
Ruth Kelly
Labour gain
|
| Con |
 |
17,270 |
35.13% |
| Lab |
 |
24,342 |
49.52% |
| LD |
 |
5,309 |
10.80% |
| Ref |
 |
865 |
1.76% |
| Oth |
 |
1,374 |
2.79% |
| Maj |
 |
7,072 |
14.39% |
| Turn |
 |
49,160 |
77.37% |
|
|
 |
|
Conservative
|
| Con |
 |
24,619 |
47.30% |
| Lab |
 |
20,338 |
39.10% |
| LD |
 |
6,862 |
13.20% |
| Oth |
 |
208 |
0.40% |
| Maj |
 |
4,281 |
8.20% |
| Turn |
 |
52,027 |
82.49% |
|
|
 |
|

|

