|
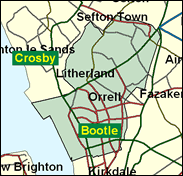
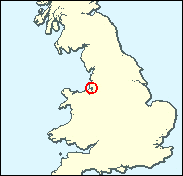
Bootle
Labour hold

The very safest of all the 418 Labour seats won in 1997, with a share of the vote of 82.9pc, 74.4pc ahead of the Conservative in what would be flattering to describe as second place. This is as monolithic as things get in Britain. Locals here might ask what the point is in voting for any other party, or even in voting at all. Turnout in the June 1999 Euro-elections was just 12.6pc, among the lowest in Britain. Clearly affairs in Strasbourg and Brussels impinge little on the electors of Bootle. The winner here is of course without question, but those who care about civics and the health of a democratic society at all as well as about politics will wonder how far affairs in Westminster are perceived to impinge too. Two thirds of those registered did bother to vote in 1997 which is not at all bad by international standards. Nor are the social indicators in general of an extreme nature. This is far from the most working class seat in Britain, and half of the households are owner occupiers. There are no real ethnic problems; there is scarcely an ethnic mix. Neither unemployment nor crime, though above average, are the worst in the land. The extraordinary political result probably owes most of all to region and culture and also perhaps the history of local government. This is the heart of Merseyside without the problems of Liverpool City Council; indeed as part of the bizarrely drawn Sefton Metropolitan Borough, which also includes Crosby, Formby and even Southport, Labour are not even in control here, so cannot be blamed for municipal shortcomings.

Joe Benton, a former Labour whip from a classic working class Liverpool Catholic background, who was elected here in 1990, was born in 1933 and after Catholic schooling worked successively as a clerk in a shipping company and a personnel officer with Girobank. He defends Liverpool pools firms against the National Lottery and as a Catholic opposes abortion, embryo research, homosexuality and euthanasia. He was dropped as a whip on the morrow of victory in 1997.

 |
| Wealthy Achievers, Suburban Areas |
0.00% |
14.99% |
0.00 |
|
| Affluent Greys, Rural Communities |
0.00% |
2.13% |
0.00 |
|
| Prosperous Pensioners, Retirement Areas |
0.00% |
2.49% |
0.00 |
|
| Affluent Executives, Family Areas |
0.00% |
4.43% |
0.00 |
|
| Well-Off Workers, Family Areas |
2.11% |
7.27% |
29.06 |
|
| Affluent Urbanites, Town & City Areas |
0.00% |
2.56% |
0.00 |
|
| Prosperous Professionals, Metropolitan Areas |
0.00% |
2.04% |
0.00 |
|
| Better-Off Executives, Inner City Areas |
1.58% |
3.94% |
39.95 |
|
| Comfortable Middle Agers, Mature Home Owning Areas |
10.71% |
13.04% |
82.11 |
|
| Skilled Workers, Home Owning Areas |
17.38% |
12.70% |
136.80 |
|
| New Home Owners, Mature Communities |
4.11% |
8.14% |
50.51 |
|
| White Collar Workers, Better-Off Multi Ethnic Areas |
0.96% |
4.02% |
23.80 |
|
| Older People, Less Prosperous Areas |
5.13% |
3.19% |
161.01 |
|
| Council Estate Residents, Better-Off Homes |
46.89% |
11.31% |
414.56 |
|
| Council Estate Residents, High Unemployment |
3.89% |
3.06% |
127.07 |
|
| Council Estate Residents, Greatest Hardship |
7.25% |
2.52% |
287.72 |
|
| People in Multi-Ethnic, Low-Income Areas |
0.00% |
2.10% |
0.00 |
|
| Unclassified |
0.00% |
0.06% |
0.00 |
|
|
 |
|
|
| £0-5K |
16.17% |
9.41% |
171.80 |
|
| £5-10K |
25.20% |
16.63% |
151.48 |
|
| £10-15K |
20.76% |
16.58% |
125.24 |
|
| £15-20K |
13.90% |
13.58% |
102.32 |
|
| £20-25K |
8.72% |
10.39% |
83.94 |
|
| £25-30K |
5.40% |
7.77% |
69.48 |
|
| £30-35K |
3.37% |
5.79% |
58.11 |
|
| £35-40K |
2.13% |
4.33% |
49.13 |
|
| £40-45K |
1.37% |
3.27% |
41.97 |
|
| £45-50K |
0.90% |
2.48% |
36.21 |
|
| £50-55K |
0.60% |
1.90% |
31.52 |
|
| £55-60K |
0.41% |
1.47% |
27.67 |
|
| £60-65K |
0.28% |
1.15% |
24.48 |
|
| £65-70K |
0.20% |
0.91% |
21.81 |
|
| £70-75K |
0.14% |
0.72% |
19.56 |
|
| £75-80K |
0.10% |
0.57% |
17.65 |
|
| £80-85K |
0.07% |
0.46% |
16.00 |
|
| £85-90K |
0.05% |
0.37% |
14.58 |
|
| £90-95K |
0.04% |
0.31% |
13.35 |
|
| £95-100K |
0.03% |
0.25% |
12.27 |
|
| £100K + |
0.11% |
1.34% |
8.14 |
|
|
|
|


|
1992-1997
|
1997-2001
|
|
|
|
| Con |
-5.61% |
| Lab |
6.35% |
| LD |
-0.77% |
|
| Con |
-0.54% |
| Lab |
-5.30% |
| LD |
2.81% |
|
|
|
Joe Benton
Labour hold
|
| Con |
 |
2,194 |
7.95% |
| Lab |
 |
21,400 |
77.55% |
| LD |
 |
2,357 |
8.54% |
| Oth |
 |
1,643 |
5.95% |
| Maj |
 |
19,043 |
69.01% |
| Turn |
|
27,594 |
49.00% |
|
|
|
Joe Benton
Labour hold
|
| L |
Joe Benton |
21,400 |
77.55% |
| SL |
Dave Flynn |
971 |
3.52% |
| SA |
Peter Glover |
672 |
2.44% |
| LD |
Jim Murray |
2,357 |
8.54% |
| C |
Judith Symes |
2,194 |
7.95% |
|
Candidates representing 5 parties stood for election to this seat.
|
|
|
Joe Benton
Labour
|
| Con |
|
3,247 |
8.49% |
| Lab |
|
31,668 |
82.85% |
| LD |
|
2,191 |
5.73% |
| Ref |
 |
571 |
1.49% |
| Oth |
|
546 |
1.43% |
| Maj |
|
28,421 |
74.36% |
| Turn |
|
38,223 |
66.73% |
|
|
|
|
Labour
|
| Con |
|
6,130 |
14.10% |
| Lab |
|
33,250 |
76.50% |
| LD |
|
2,812 |
6.50% |
| Oth |
|
1,248 |
2.90% |
| Maj |
|
27,120 |
62.40% |
| Turn |
|
43,440 |
71.31% |
|
|
|
|
|