|
Bosworth
Conservative hold

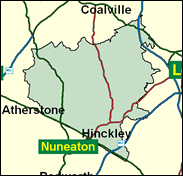
The Conservatives only won Bosworth in Leicestershire by a thousand votes in 1997, but already by the May 1999 local elections signs of a safer win in the next General Election were tentatively visible, as they won six wards within the constituency to Labour's four; perhaps a sign of their improvement was to be found in Ambien ward, which they gained from Labour by just one vote. In the Euro-elections one month later, the Tories were twenty per cent ahead here. The largest town is Hinckley, which was fairly evenly divided in 1997, and Labour's best area was Earl Shilton, while the Conservatives were ahead in Market Bosworth, Barwell and Burbage - we can tell all this from the county council results on the same day. The Liberal Democrats did much better in these than in the Westminster election, but this was more likely to be due to their perceived suitability for local government than tactical voting for Labour to get the Tory out. For the technically minded, this argument can be defended from an analysis of the comparison of the 1997 General Election results with the 1999 European elections, which were fought on a regional list system which did not encourage tactical voting of any kind; the results are, however, available by constituency.

David Tredinnick, a tall angular stiff-necked, red-faced ex-Guards officer and loss-making Member of Lloyds, born 1950, and Eton, Capetown University and St. John's College, Oxford-educated, was one of the few sleaze-tainted - in his case cash-for-questions - Conservative MPs to survive the 1997 Tory wipe-out. Unkindly dubbed (by Andrew Rawnsley) "memorably forgettable", and never closer to office than as PPS to a junior Welsh Office minister for three years in the early 'nineties, he is keen on complementary medicine being available on the NHS since damaging his spine on falling from a horse. Labour is fighting Bosworth with PR man Andrew Furlong, currently with the Institute of Chemical Engineers. Born in 1961, he was educated at Pembroke Comprehensive and read chemistry at Brunel University.

 |
| Wealthy Achievers, Suburban Areas |
21.84% |
14.99% |
145.69 |
|
| Affluent Greys, Rural Communities |
0.09% |
2.13% |
4.41 |
|
| Prosperous Pensioners, Retirement Areas |
0.26% |
2.49% |
10.49 |
|
| Affluent Executives, Family Areas |
6.14% |
4.43% |
138.82 |
|
| Well-Off Workers, Family Areas |
21.56% |
7.27% |
296.39 |
|
| Affluent Urbanites, Town & City Areas |
0.23% |
2.56% |
8.94 |
|
| Prosperous Professionals, Metropolitan Areas |
0.00% |
2.04% |
0.00 |
|
| Better-Off Executives, Inner City Areas |
0.00% |
3.94% |
0.00 |
|
| Comfortable Middle Agers, Mature Home Owning Areas |
11.31% |
13.04% |
86.73 |
|
| Skilled Workers, Home Owning Areas |
20.80% |
12.70% |
163.71 |
|
| New Home Owners, Mature Communities |
9.56% |
8.14% |
117.35 |
|
| White Collar Workers, Better-Off Multi Ethnic Areas |
0.45% |
4.02% |
11.12 |
|
| Older People, Less Prosperous Areas |
2.25% |
3.19% |
70.60 |
|
| Council Estate Residents, Better-Off Homes |
5.40% |
11.31% |
47.77 |
|
| Council Estate Residents, High Unemployment |
0.11% |
3.06% |
3.61 |
|
| Council Estate Residents, Greatest Hardship |
0.00% |
2.52% |
0.00 |
|
| People in Multi-Ethnic, Low-Income Areas |
0.00% |
2.10% |
0.00 |
|
| Unclassified |
0.00% |
0.06% |
0.00 |
|
|
 |
 |
 |
| £0-5K |
8.00% |
9.41% |
84.99 |
|
| £5-10K |
15.15% |
16.63% |
91.11 |
|
| £10-15K |
16.18% |
16.58% |
97.60 |
|
| £15-20K |
13.92% |
13.58% |
102.48 |
|
| £20-25K |
10.98% |
10.39% |
105.67 |
|
| £25-30K |
8.36% |
7.77% |
107.52 |
|
| £30-35K |
6.28% |
5.79% |
108.44 |
|
| £35-40K |
4.71% |
4.33% |
108.74 |
|
| £40-45K |
3.55% |
3.27% |
108.64 |
|
| £45-50K |
2.69% |
2.48% |
108.29 |
|
| £50-55K |
2.05% |
1.90% |
107.81 |
|
| £55-60K |
1.58% |
1.47% |
107.24 |
|
| £60-65K |
1.23% |
1.15% |
106.63 |
|
| £65-70K |
0.96% |
0.91% |
106.00 |
|
| £70-75K |
0.76% |
0.72% |
105.38 |
|
| £75-80K |
0.60% |
0.57% |
104.76 |
|
| £80-85K |
0.48% |
0.46% |
104.16 |
|
| £85-90K |
0.39% |
0.37% |
103.57 |
|
| £90-95K |
0.31% |
0.31% |
103.01 |
|
| £95-100K |
0.26% |
0.25% |
102.47 |
|
| £100K + |
1.34% |
1.34% |
99.46 |
|
|
|

|


|
1992-1997
|
1997-2001
|
|
|
|
| Con |
-10.97% |
| Lab |
12.26% |
| LD |
-2.90% |
|
| Con |
3.78% |
| Lab |
0.69% |
| LD |
-1.55% |
|
|
 |
David Tredinnick
Conservative hold
|
| Con |
 |
20,030 |
44.41% |
| Lab |
 |
17,750 |
39.35% |
| LD |
 |
7,326 |
16.24% |
| Oth |
|
0 |
0.00% |
| Maj |
 |
2,280 |
5.05% |
| Turn |
 |
45,106 |
64.44% |
|
|
 |
David Tredinnick
Conservative hold
|
| LD |
Jon Ellis |
7,326 |
16.24% |
| L |
Andrew Furlong |
17,750 |
39.35% |
| C |
David Tredinnick |
20,030 |
44.41% |
|
Candidates representing 3 parties stood for election to this seat.
|
|
 |
David Tredinnick
Conservative
|
| Con |
 |
21,189 |
40.63% |
| Lab |
 |
20,162 |
38.66% |
| LD |
 |
9,281 |
17.80% |
| Ref |
 |
1,521 |
2.92% |
| Oth |
|
0 |
0.00% |
| Maj |
 |
1,027 |
1.97% |
| Turn |
 |
52,153 |
76.57% |
|
|
 |
|
Conservative
|
| Con |
 |
28,863 |
51.60% |
| Lab |
 |
14,732 |
26.40% |
| LD |
 |
11,576 |
20.70% |
| Oth |
 |
716 |
1.30% |
| Maj |
 |
14,131 |
25.30% |
| Turn |
 |
55,887 |
84.14% |
|
|
 |
|

|

