|
Bradford North
Labour hold

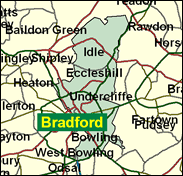
This seat is somewhat misnamed, as it in fact consists more of a kidney-shaped swathe of eastern wards in the second city of West Yorkshire. Although there is a substantial Asian population, mainly Muslim, there has been less influence of, and discordance between, ethnic minority groups here. Indeed the MP is the only Mormon in the Commons. After a long period of hectic electoral activity, involving an SDP defection and a period of Coinservative party representation, under Terry Rooney, North seem to have settled down into a period of quiet Labour success.

Terry Rooney, a dour-looking Catholic-turned-Mormon at his wife's instigation, is a loyalist - as PPS to Michael Meacher - and was dubbed a 'Walworth Road puppet' after replacing in 1990 the dead Militant-linked MP Pat Wall, whose trotskyist associates he had helped purge. Born 1950 and educated at Buttershaw Comprehensive and Bradford & Ilkley Community College, he was a welfare rights advice worker for nine years after ten years as an insurance broker. A former Bradford councillor, his experience of badly-funded welfare makes him a supporter of the 'welfare to work' strategy.

 |
| Wealthy Achievers, Suburban Areas |
2.38% |
14.99% |
15.89 |
|
| Affluent Greys, Rural Communities |
0.00% |
2.13% |
0.00 |
|
| Prosperous Pensioners, Retirement Areas |
0.00% |
2.49% |
0.00 |
|
| Affluent Executives, Family Areas |
1.26% |
4.43% |
28.54 |
|
| Well-Off Workers, Family Areas |
6.12% |
7.27% |
84.15 |
|
| Affluent Urbanites, Town & City Areas |
1.03% |
2.56% |
40.35 |
|
| Prosperous Professionals, Metropolitan Areas |
0.00% |
2.04% |
0.00 |
|
| Better-Off Executives, Inner City Areas |
0.76% |
3.94% |
19.25 |
|
| Comfortable Middle Agers, Mature Home Owning Areas |
12.89% |
13.04% |
98.85 |
|
| Skilled Workers, Home Owning Areas |
20.64% |
12.70% |
162.45 |
|
| New Home Owners, Mature Communities |
5.58% |
8.14% |
68.49 |
|
| White Collar Workers, Better-Off Multi Ethnic Areas |
2.65% |
4.02% |
65.86 |
|
| Older People, Less Prosperous Areas |
4.34% |
3.19% |
136.32 |
|
| Council Estate Residents, Better-Off Homes |
19.59% |
11.31% |
173.23 |
|
| Council Estate Residents, High Unemployment |
3.80% |
3.06% |
124.15 |
|
| Council Estate Residents, Greatest Hardship |
4.38% |
2.52% |
173.97 |
|
| People in Multi-Ethnic, Low-Income Areas |
14.57% |
2.10% |
693.82 |
|
| Unclassified |
0.00% |
0.06% |
0.00 |
|
|
 |
 |
 |
| £0-5K |
12.42% |
9.41% |
131.93 |
|
| £5-10K |
20.96% |
16.63% |
126.03 |
|
| £10-15K |
19.17% |
16.58% |
115.64 |
|
| £15-20K |
14.30% |
13.58% |
105.29 |
|
| £20-25K |
9.96% |
10.39% |
95.85 |
|
| £25-30K |
6.80% |
7.77% |
87.47 |
|
| £30-35K |
4.64% |
5.79% |
80.12 |
|
| £35-40K |
3.19% |
4.33% |
73.69 |
|
| £40-45K |
2.22% |
3.27% |
68.09 |
|
| £45-50K |
1.57% |
2.48% |
63.20 |
|
| £50-55K |
1.12% |
1.90% |
58.93 |
|
| £55-60K |
0.81% |
1.47% |
55.19 |
|
| £60-65K |
0.60% |
1.15% |
51.90 |
|
| £65-70K |
0.44% |
0.91% |
48.99 |
|
| £70-75K |
0.33% |
0.72% |
46.41 |
|
| £75-80K |
0.25% |
0.57% |
44.12 |
|
| £80-85K |
0.19% |
0.46% |
42.08 |
|
| £85-90K |
0.15% |
0.37% |
40.24 |
|
| £90-95K |
0.12% |
0.31% |
38.58 |
|
| £95-100K |
0.09% |
0.25% |
37.09 |
|
| £100K + |
0.41% |
1.34% |
30.48 |
|
|
|

|


|
1992-1997
|
1997-2001
|
|
|
|
| Con |
-6.61% |
| Lab |
8.28% |
| LD |
-4.18% |
|
| Con |
-1.46% |
| Lab |
-6.33% |
| LD |
5.25% |
|
|
 |
Terry Rooney
Labour hold
|
| Con |
 |
8,450 |
24.13% |
| Lab |
 |
17,419 |
49.74% |
| LD |
 |
6,924 |
19.77% |
| Oth |
 |
2,224 |
6.35% |
| Maj |
 |
8,969 |
25.61% |
| Turn |
 |
35,017 |
52.69% |
|
|
 |
Terry Rooney
Labour hold
|
| BNP |
John Brayshaw |
1,613 |
4.61% |
| C |
Zahid Iqbal |
8,450 |
24.13% |
| L |
Terry Rooney |
17,419 |
49.74% |
| G |
Steven Schofield |
611 |
1.74% |
| LD |
David Ward |
6,924 |
19.77% |
|
Candidates representing 5 parties stood for election to this seat.
|
|
 |
Terry Rooney
Labour
|
| Con |
 |
10,723 |
25.59% |
| Lab |
 |
23,493 |
56.08% |
| LD |
 |
6,083 |
14.52% |
| Ref |
 |
1,227 |
2.93% |
| Oth |
 |
369 |
0.88% |
| Maj |
 |
12,770 |
30.48% |
| Turn |
 |
41,895 |
63.26% |
|
|
 |
|
Labour
|
| Con |
 |
15,756 |
32.20% |
| Lab |
 |
23,420 |
47.80% |
| LD |
 |
9,133 |
18.70% |
| Oth |
 |
654 |
1.30% |
| Maj |
 |
7,664 |
15.70% |
| Turn |
 |
48,963 |
73.06% |
|
|
 |
|

|

