|
Bradford South
Labour hold

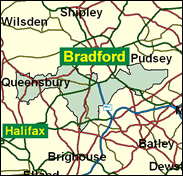
The smallest percentage of non-white residents in the borough (less than a tenth) is to be found in Bradford's South constituency, which might surprise the ignorant characters who think that the former woollen metropolis east of the Pennines is now predominantly Asian. There are a variety of neighbourhoods all the same, from the depressed council estate of Buttershaw to the independent town of Queensbury, set very high in the hills to the south west. Many of the wards are historically marginal, and they were almost all closely fought in the most recent local elections in May 2000. The General Election in 1997 was the first to be won by a really decisive majority in Bradford South since 1966 - and it should be remembered that in 1970 the Labour majority went back down to less than 2,000. A reduction again seems probable in 2001.

Gerry Sutcliffe, MP here since 1994 is a Labour whip who previously was PPS to the hapless Harriet Harman, and less hapless Stephen Byers. Though a Blairite loyalist, his print union background explained his hard lobbying during the legislation to restore union workplace negotiation rights. Born 1953 and educated at Cardinal Hinsley (RC) Grammar School, Bradford, he rose locally to lead Bradford Council as an opponent of the leftwing "trendy Wendys and Nigels" and the Militant left, and having failed to replace Militant-linked MP Pat Wall in Bradford North, he was preparing a similar challenge to hard left-winger Bob Cryer in Bradford South when Cryer was killed in a car crash, so creating the vacancy he filled.

 |
| Wealthy Achievers, Suburban Areas |
0.99% |
14.99% |
6.60 |
|
| Affluent Greys, Rural Communities |
0.00% |
2.13% |
0.00 |
|
| Prosperous Pensioners, Retirement Areas |
0.03% |
2.49% |
1.06 |
|
| Affluent Executives, Family Areas |
0.62% |
4.43% |
14.07 |
|
| Well-Off Workers, Family Areas |
14.61% |
7.27% |
200.82 |
|
| Affluent Urbanites, Town & City Areas |
0.00% |
2.56% |
0.00 |
|
| Prosperous Professionals, Metropolitan Areas |
0.00% |
2.04% |
0.00 |
|
| Better-Off Executives, Inner City Areas |
0.27% |
3.94% |
6.86 |
|
| Comfortable Middle Agers, Mature Home Owning Areas |
9.48% |
13.04% |
72.70 |
|
| Skilled Workers, Home Owning Areas |
32.55% |
12.70% |
256.28 |
|
| New Home Owners, Mature Communities |
5.75% |
8.14% |
70.63 |
|
| White Collar Workers, Better-Off Multi Ethnic Areas |
1.16% |
4.02% |
28.94 |
|
| Older People, Less Prosperous Areas |
4.48% |
3.19% |
140.69 |
|
| Council Estate Residents, Better-Off Homes |
19.37% |
11.31% |
171.23 |
|
| Council Estate Residents, High Unemployment |
1.44% |
3.06% |
47.04 |
|
| Council Estate Residents, Greatest Hardship |
7.25% |
2.52% |
287.98 |
|
| People in Multi-Ethnic, Low-Income Areas |
1.99% |
2.10% |
94.56 |
|
| Unclassified |
0.01% |
0.06% |
11.38 |
|
|
 |
 |
 |
| £0-5K |
10.88% |
9.41% |
115.63 |
|
| £5-10K |
19.02% |
16.63% |
114.34 |
|
| £10-15K |
18.49% |
16.58% |
111.50 |
|
| £15-20K |
14.56% |
13.58% |
107.18 |
|
| £20-25K |
10.59% |
10.39% |
101.86 |
|
| £25-30K |
7.47% |
7.77% |
96.08 |
|
| £30-35K |
5.23% |
5.79% |
90.25 |
|
| £35-40K |
3.67% |
4.33% |
84.63 |
|
| £40-45K |
2.59% |
3.27% |
79.35 |
|
| £45-50K |
1.85% |
2.48% |
74.47 |
|
| £50-55K |
1.33% |
1.90% |
70.03 |
|
| £55-60K |
0.97% |
1.47% |
65.99 |
|
| £60-65K |
0.72% |
1.15% |
62.35 |
|
| £65-70K |
0.54% |
0.91% |
59.06 |
|
| £70-75K |
0.40% |
0.72% |
56.10 |
|
| £75-80K |
0.31% |
0.57% |
53.43 |
|
| £80-85K |
0.24% |
0.46% |
51.02 |
|
| £85-90K |
0.18% |
0.37% |
48.83 |
|
| £90-95K |
0.14% |
0.31% |
46.86 |
|
| £95-100K |
0.11% |
0.25% |
45.06 |
|
| £100K + |
0.50% |
1.34% |
37.24 |
|
|
|

|


|
1992-1997
|
1997-2001
|
|
|
|
| Con |
-10.39% |
| Lab |
9.12% |
| LD |
-2.40% |
|
| Con |
0.28% |
| Lab |
-0.93% |
| LD |
-0.72% |
|
|
 |
Gerry Sutcliffe
Labour hold
|
| Con |
 |
9,941 |
28.29% |
| Lab |
 |
19,603 |
55.79% |
| LD |
 |
3,717 |
10.58% |
| Oth |
 |
1,876 |
5.34% |
| Maj |
 |
9,662 |
27.50% |
| Turn |
 |
35,137 |
100.00% |
|
|
 |
Gerry Sutcliffe
Labour hold
|
| SL |
Tony Kelly |
571 |
1.63% |
| UK |
Peter North |
783 |
2.23% |
| DW |
George Riseborough |
220 |
0.63% |
| SA |
Ateeq Siddigue |
302 |
0.86% |
| L |
Gerry Sutcliffe |
19,603 |
55.79% |
| C |
Graham Tennyson |
9,941 |
28.29% |
| LD |
Alexander Wilson-Fletcher |
3,717 |
10.58% |
|
Candidates representing 7 parties stood for election to this seat.
|
|
 |
Gerry Sutcliffe
Labour
|
| Con |
 |
12,622 |
28.01% |
| Lab |
 |
25,558 |
56.72% |
| LD |
 |
5,093 |
11.30% |
| Ref |
 |
1,785 |
3.96% |
| Oth |
|
0 |
0.00% |
| Maj |
 |
12,936 |
28.71% |
| Turn |
 |
45,058 |
65.88% |
|
|
 |
|
Labour
|
| Con |
 |
20,283 |
38.40% |
| Lab |
 |
25,185 |
47.60% |
| LD |
 |
7,243 |
13.70% |
| Oth |
 |
156 |
0.30% |
| Maj |
 |
4,902 |
9.30% |
| Turn |
 |
52,867 |
75.14% |
|
|
 |
|

|

