|
Bradford West
Labour hold

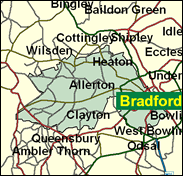
In the 1997 General Election the Conservatives managed, almost uniquely, to slash Labour's lead in this seat, largely, it is thought, due to their selection of a Muslim candidate, Mohammed Riaz, to oppose Labour's choice Marsha Singh, from a much less populous ethnic group here, the Sikhs. The Tories hope to do even better at the next election, and have selected the same candidate to that end. West is the only seat in Bradford which has really seen the impact of race on politics. Over a third of the population was non-white here, concentrated in the inner sections of the seat instead of on the edge of the city at Clayton and Thornton. In general the Asian presence has helped Labour in a seat which is still the most middle class in the city, including its old west end in Heaton. It is clear now that it swings to a different rhthym from that of the rest of Britain, which makes its results unpredictable and exciting.

Marsha Singh is one of Labour's ten non-white MPs, in his case a secular Sikh (born in the Punjab in 1954, educated at Bellvue Boys Upper School, Bradford and Loughborough University), who finds himself representing a large local population of Pakistani muslims, and so exposed to the "ethnic factionalism" he deplores. Such ethnic complexities explain the anti-Labour swing he suffered when elected here in 1997. Inevitably required to articulate Kashmiri grievances, he has sought to focus on non-racial issues such as the meanstesting of applications for local authority residential accommodation, and on pensions linking to average earnings, on which he rebelled in 2000.

 |
| Wealthy Achievers, Suburban Areas |
5.52% |
14.99% |
36.83 |
|
| Affluent Greys, Rural Communities |
0.00% |
2.13% |
0.00 |
|
| Prosperous Pensioners, Retirement Areas |
0.15% |
2.49% |
5.84 |
|
| Affluent Executives, Family Areas |
1.18% |
4.43% |
26.65 |
|
| Well-Off Workers, Family Areas |
4.88% |
7.27% |
67.11 |
|
| Affluent Urbanites, Town & City Areas |
3.47% |
2.56% |
135.17 |
|
| Prosperous Professionals, Metropolitan Areas |
0.01% |
2.04% |
0.25 |
|
| Better-Off Executives, Inner City Areas |
3.60% |
3.94% |
91.28 |
|
| Comfortable Middle Agers, Mature Home Owning Areas |
10.78% |
13.04% |
82.66 |
|
| Skilled Workers, Home Owning Areas |
7.68% |
12.70% |
60.50 |
|
| New Home Owners, Mature Communities |
2.93% |
8.14% |
35.96 |
|
| White Collar Workers, Better-Off Multi Ethnic Areas |
3.57% |
4.02% |
88.84 |
|
| Older People, Less Prosperous Areas |
1.66% |
3.19% |
52.02 |
|
| Council Estate Residents, Better-Off Homes |
19.14% |
11.31% |
169.20 |
|
| Council Estate Residents, High Unemployment |
4.37% |
3.06% |
142.66 |
|
| Council Estate Residents, Greatest Hardship |
2.44% |
2.52% |
96.79 |
|
| People in Multi-Ethnic, Low-Income Areas |
28.64% |
2.10% |
1,363.59 |
|
| Unclassified |
0.00% |
0.06% |
0.00 |
|
|
 |
 |
 |
| £0-5K |
15.63% |
9.41% |
165.99 |
|
| £5-10K |
22.08% |
16.63% |
132.76 |
|
| £10-15K |
18.63% |
16.58% |
112.38 |
|
| £15-20K |
13.32% |
13.58% |
98.05 |
|
| £20-25K |
9.08% |
10.39% |
87.37 |
|
| £25-30K |
6.15% |
7.77% |
79.09 |
|
| £30-35K |
4.20% |
5.79% |
72.46 |
|
| £35-40K |
2.90% |
4.33% |
67.04 |
|
| £40-45K |
2.04% |
3.27% |
62.51 |
|
| £45-50K |
1.46% |
2.48% |
58.67 |
|
| £50-55K |
1.05% |
1.90% |
55.37 |
|
| £55-60K |
0.77% |
1.47% |
52.49 |
|
| £60-65K |
0.58% |
1.15% |
49.97 |
|
| £65-70K |
0.43% |
0.91% |
47.72 |
|
| £70-75K |
0.33% |
0.72% |
45.71 |
|
| £75-80K |
0.25% |
0.57% |
43.90 |
|
| £80-85K |
0.20% |
0.46% |
42.26 |
|
| £85-90K |
0.15% |
0.37% |
40.76 |
|
| £90-95K |
0.12% |
0.31% |
39.38 |
|
| £95-100K |
0.10% |
0.25% |
38.12 |
|
| £100K + |
0.43% |
1.34% |
31.99 |
|
|
|

|


|
1992-1997
|
1997-2001
|
|
|
|
| Con |
-0.76% |
| Lab |
-11.65% |
| LD |
4.28% |
|
| Con |
4.06% |
| Lab |
6.41% |
| LD |
-8.43% |
|
|
 |
Marsha Singh
Labour hold
|
| Con |
 |
14,236 |
37.10% |
| Lab |
 |
18,401 |
47.96% |
| LD |
 |
2,437 |
6.35% |
| Oth |
 |
3,296 |
8.59% |
| Maj |
 |
4,165 |
10.85% |
| Turn |
 |
38,370 |
53.57% |
|
|
 |
Marsha Singh
Labour hold
|
| UK |
Imran Hussain |
427 |
1.11% |
| AL |
Farhan Khokhar |
197 |
0.51% |
| LD |
Abdul Rauf Khan |
2,437 |
6.35% |
| C |
Mohammed Riaz |
14,236 |
37.10% |
| G |
John Robinson |
2,672 |
6.96% |
| L |
Marsha Singh |
18,401 |
47.96% |
|
Candidates representing 6 parties stood for election to this seat.
|
|
 |
Marsha Singh
Labour
|
| Con |
 |
15,055 |
33.04% |
| Lab |
 |
18,932 |
41.55% |
| LD |
 |
6,737 |
14.78% |
| Ref |
 |
1,348 |
2.96% |
| Oth |
 |
3,496 |
7.67% |
| Maj |
 |
3,877 |
8.51% |
| Turn |
 |
45,568 |
63.32% |
|
|
 |
|
Labour
|
| Con |
 |
16,544 |
33.80% |
| Lab |
 |
26,046 |
53.20% |
| LD |
 |
5,150 |
10.50% |
| Oth |
 |
1,206 |
2.50% |
| Maj |
 |
9,502 |
19.40% |
| Turn |
 |
48,946 |
69.16% |
|
|
 |
|

|

