|
Braintree
Labour hold

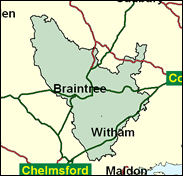
Labour's 13th most vulnerable seat is Braintree in Essex, and although many - indeed most - outside observers expect the seat to revert to the Tories, who held it till 1997, it might be remembered that in the May 1999 local elections here the Conservtives returned only 8 councillors to Labour's 28, and Labour retained control of the council. This required victories in semi-rural areas such as Kelvedon and Coggeshall as well as the larger Braintree-Bocking, and Alan Hurst should perhaps not be completely written off yet.

Alan Hurst, a very unexpected Labour MP swept in on the 1997 floodtide, is a mild-mannered Southend solicitor, born 1945 and educated at Westcliffe High School and Liverpool University. Initially he adopted the mode of a diligent constituency MP dealing with local concerns on cottage hospitals, school buses and beef farming, and as a defender of the traditional single Member first-past-the-post voting system. But latterly he has upped his profile with revolts on linking pensions to average earnings, curbing jury trials, and the right of the Prime Minister to nominate life peers. Statistically he should meet his nemesis in Brooks Newmark, US-born (1958) but Chilterns-reared venture capital banker, who was educated at Bedford School, Worcester College Oxford, and Harvard. Originally with Lehman Brothers on Wall Street, he now runs Apollo Management. He fought Newcastle Central for the Conservatives in 1997.

 |
| Wealthy Achievers, Suburban Areas |
19.86% |
14.99% |
132.48 |
|
| Affluent Greys, Rural Communities |
0.74% |
2.13% |
34.65 |
|
| Prosperous Pensioners, Retirement Areas |
1.25% |
2.49% |
50.28 |
|
| Affluent Executives, Family Areas |
6.25% |
4.43% |
141.32 |
|
| Well-Off Workers, Family Areas |
11.78% |
7.27% |
161.92 |
|
| Affluent Urbanites, Town & City Areas |
1.54% |
2.56% |
60.09 |
|
| Prosperous Professionals, Metropolitan Areas |
0.04% |
2.04% |
1.97 |
|
| Better-Off Executives, Inner City Areas |
0.09% |
3.94% |
2.34 |
|
| Comfortable Middle Agers, Mature Home Owning Areas |
17.19% |
13.04% |
131.82 |
|
| Skilled Workers, Home Owning Areas |
9.41% |
12.70% |
74.07 |
|
| New Home Owners, Mature Communities |
10.89% |
8.14% |
133.71 |
|
| White Collar Workers, Better-Off Multi Ethnic Areas |
1.41% |
4.02% |
34.96 |
|
| Older People, Less Prosperous Areas |
3.83% |
3.19% |
120.32 |
|
| Council Estate Residents, Better-Off Homes |
14.13% |
11.31% |
124.95 |
|
| Council Estate Residents, High Unemployment |
0.28% |
3.06% |
9.02 |
|
| Council Estate Residents, Greatest Hardship |
1.31% |
2.52% |
52.09 |
|
| People in Multi-Ethnic, Low-Income Areas |
0.00% |
2.10% |
0.00 |
|
| Unclassified |
0.00% |
0.06% |
0.00 |
|
|
 |
 |
 |
| £0-5K |
7.52% |
9.41% |
79.90 |
|
| £5-10K |
14.19% |
16.63% |
85.32 |
|
| £10-15K |
15.35% |
16.58% |
92.56 |
|
| £15-20K |
13.42% |
13.58% |
98.83 |
|
| £20-25K |
10.79% |
10.39% |
103.79 |
|
| £25-30K |
8.37% |
7.77% |
107.64 |
|
| £30-35K |
6.41% |
5.79% |
110.62 |
|
| £35-40K |
4.89% |
4.33% |
112.98 |
|
| £40-45K |
3.75% |
3.27% |
114.89 |
|
| £45-50K |
2.89% |
2.48% |
116.48 |
|
| £50-55K |
2.24% |
1.90% |
117.85 |
|
| £55-60K |
1.76% |
1.47% |
119.05 |
|
| £60-65K |
1.38% |
1.15% |
120.14 |
|
| £65-70K |
1.10% |
0.91% |
121.14 |
|
| £70-75K |
0.88% |
0.72% |
122.08 |
|
| £75-80K |
0.71% |
0.57% |
122.97 |
|
| £80-85K |
0.57% |
0.46% |
123.82 |
|
| £85-90K |
0.47% |
0.37% |
124.64 |
|
| £90-95K |
0.38% |
0.31% |
125.44 |
|
| £95-100K |
0.32% |
0.25% |
126.22 |
|
| £100K + |
1.76% |
1.34% |
131.19 |
|
|
|

|


|
1992-1997
|
1997-2001
|
|
|
|
| Con |
-10.41% |
| Lab |
15.30% |
| LD |
-9.25% |
|
| Con |
1.18% |
| Lab |
-0.71% |
| LD |
-0.29% |
|
|
 |
Alan Hurst
Labour hold
|
| Con |
 |
20,765 |
41.27% |
| Lab |
 |
21,123 |
41.98% |
| LD |
 |
5,664 |
11.26% |
| Oth |
 |
2,763 |
5.49% |
| Maj |
 |
358 |
0.71% |
| Turn |
 |
50,315 |
63.56% |
|
|
 |
Alan Hurst
Labour hold
|
| G |
James Abbott |
1,241 |
2.47% |
| UK |
Charles Cole |
748 |
1.49% |
| L |
Alan Hurst |
21,123 |
41.98% |
| C |
Brooks Newmark |
20,765 |
41.27% |
| LCA |
Michael Nolan |
774 |
1.54% |
| LD |
Peter Turner |
5,664 |
11.26% |
|
Candidates representing 6 parties stood for election to this seat.
|
|
 |
Alan Hurst
Labour gain
|
| Con |
 |
22,278 |
40.09% |
| Lab |
 |
23,729 |
42.70% |
| LD |
 |
6,418 |
11.55% |
| Ref |
 |
2,165 |
3.90% |
| Oth |
 |
986 |
1.77% |
| Maj |
 |
1,451 |
2.61% |
| Turn |
 |
55,576 |
76.37% |
|
|
 |
|
Conservative
|
| Con |
 |
29,278 |
50.50% |
| Lab |
 |
15,890 |
27.40% |
| LD |
 |
12,039 |
20.80% |
| Oth |
 |
724 |
1.20% |
| Maj |
 |
13,388 |
23.10% |
| Turn |
 |
57,931 |
83.96% |
|
|
 |
|

|

