|
Brecon & Radnorshire
Liberal Democrat hold

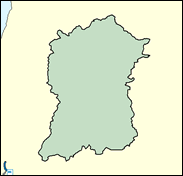
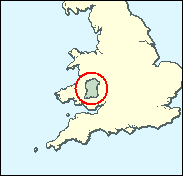
One of the Liberal Democrats' most vulnerable seats in all of Britain must be Brecon and Radnor in mid-Wales. Not only is their redoubtable campaigner Richard Livsey retiring - he won this three way marginal in the 1985 by-election, and in the General Elections in 1987 and 1997; but it should be remembered that the Conservatives won here in 1992, and also polled the most votes within the seat in the 1999 Euro-elections, with the Lib Dems in third place. It will be a tough task for Roger Williams to hold on in one of the ten seats with the highest proportion of those employed in agriculture, a huge chunk of mid Wales (this has the largest area of any seat in the principality at just over 300,000 hectares).

With the retirement of Richard Livsey - once cruelly-dubbed by a former Tory opponent as having "the personality of a cow-pat", the Liberal Democrats are fielding here Roger Williams, a pudgy-faced farmer and local councillor and seasoned campaigner on farming a rural
concerns, who was born in 1948 and educated at Christ's College , Brecon and Selwyn College, Cambridge - exactly the same educational pedigree as the Lib Dem MP Simon Hughes. The Conservatives are seeking to retake this seat with the exotic Dr. Felix Aubel, a "single-with-partner Congregational Minister," former teacher and university lecturer, born 1960, and educated in a Pontypridd comprehensive and at Lampeter and Cardiff Universities.

 |
| Wealthy Achievers, Suburban Areas |
9.62% |
14.99% |
64.17 |
|
| Affluent Greys, Rural Communities |
27.27% |
2.13% |
1,282.72 |
|
| Prosperous Pensioners, Retirement Areas |
2.75% |
2.49% |
110.76 |
|
| Affluent Executives, Family Areas |
1.23% |
4.43% |
27.72 |
|
| Well-Off Workers, Family Areas |
0.03% |
7.27% |
0.38 |
|
| Affluent Urbanites, Town & City Areas |
0.64% |
2.56% |
25.03 |
|
| Prosperous Professionals, Metropolitan Areas |
0.00% |
2.04% |
0.00 |
|
| Better-Off Executives, Inner City Areas |
2.60% |
3.94% |
66.00 |
|
| Comfortable Middle Agers, Mature Home Owning Areas |
19.13% |
13.04% |
146.74 |
|
| Skilled Workers, Home Owning Areas |
5.86% |
12.70% |
46.10 |
|
| New Home Owners, Mature Communities |
14.89% |
8.14% |
182.88 |
|
| White Collar Workers, Better-Off Multi Ethnic Areas |
7.35% |
4.02% |
182.67 |
|
| Older People, Less Prosperous Areas |
2.39% |
3.19% |
74.99 |
|
| Council Estate Residents, Better-Off Homes |
6.23% |
11.31% |
55.10 |
|
| Council Estate Residents, High Unemployment |
0.00% |
3.06% |
0.00 |
|
| Council Estate Residents, Greatest Hardship |
0.00% |
2.52% |
0.00 |
|
| People in Multi-Ethnic, Low-Income Areas |
0.00% |
2.10% |
0.00 |
|
| Unclassified |
0.00% |
0.06% |
4.70 |
|
|
 |
 |
 |
| £0-5K |
10.30% |
9.41% |
109.39 |
|
| £5-10K |
18.86% |
16.63% |
113.37 |
|
| £10-15K |
18.55% |
16.58% |
111.86 |
|
| £15-20K |
14.59% |
13.58% |
107.44 |
|
| £20-25K |
10.59% |
10.39% |
101.93 |
|
| £25-30K |
7.48% |
7.77% |
96.26 |
|
| £30-35K |
5.26% |
5.79% |
90.84 |
|
| £35-40K |
3.72% |
4.33% |
85.84 |
|
| £40-45K |
2.65% |
3.27% |
81.30 |
|
| £45-50K |
1.92% |
2.48% |
77.21 |
|
| £50-55K |
1.40% |
1.90% |
73.54 |
|
| £55-60K |
1.04% |
1.47% |
70.23 |
|
| £60-65K |
0.77% |
1.15% |
67.27 |
|
| £65-70K |
0.59% |
0.91% |
64.59 |
|
| £70-75K |
0.45% |
0.72% |
62.17 |
|
| £75-80K |
0.34% |
0.57% |
59.98 |
|
| £80-85K |
0.27% |
0.46% |
57.99 |
|
| £85-90K |
0.21% |
0.37% |
56.18 |
|
| £90-95K |
0.17% |
0.31% |
54.52 |
|
| £95-100K |
0.13% |
0.25% |
53.00 |
|
| £100K + |
0.62% |
1.34% |
45.94 |
|
|
|

|


|
1992-1997
|
1997-2001
|
|
|
|
| Con |
-7.14% |
| Lab |
0.34% |
| LD |
5.05% |
| PC |
0.55% |
|
| Con |
5.88% |
| Lab |
-5.25% |
| LD |
-4.00% |
| PC |
2.02% |
|
|
 |
Roger Williams
Liberal Democrat hold
|
| Con |
 |
13,073 |
34.85% |
| Lab |
 |
8,024 |
21.39% |
| LD |
 |
13,824 |
36.85% |
| PC |
 |
1,301 |
3.47% |
| Oth |
 |
1,294 |
3.45% |
| Maj |
 |
751 |
2.00% |
| Turn |
 |
37,516 |
71.81% |
|
|
 |
Roger Williams
Liberal Democrat hold
|
| C |
Felix Aubel |
13,073 |
34.85% |
| L |
Huw Irranca-Davis |
8,024 |
21.39% |
| IM |
Ian Mitchell |
762 |
2.03% |
| IN |
Robert Nicholson |
80 |
0.21% |
| PC |
Brynach Parri |
1,301 |
3.47% |
| UK |
Elizabeth Phillips |
452 |
1.20% |
| LD |
Roger Williams |
13,824 |
36.85% |
|
Candidates representing 7 parties stood for election to this seat.
|
|
 |
Richard Livsey
Liberal Democrat gain
|
| Con |
 |
12,419 |
28.96% |
| Lab |
 |
11,424 |
26.64% |
| LD |
 |
17,516 |
40.85% |
| PC |
 |
622 |
1.45% |
| Ref |
 |
900 |
2.10% |
| Oth |
|
0 |
0.00% |
| Maj |
 |
5,097 |
11.89% |
| Turn |
 |
42,881 |
82.24% |
|
|
 |
|
Conservative
|
| Con |
 |
15,977 |
36.10% |
| Lab |
 |
11,634 |
26.30% |
| LD |
 |
15,847 |
35.80% |
| PC |
 |
418 |
0.90% |
| Oth |
 |
393 |
0.90% |
| Maj |
 |
130 |
0.30% |
| Turn |
 |
44,269 |
84.34% |
|
|
 |
|

|

