|
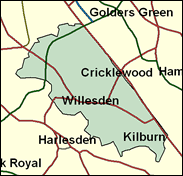
Brent East
Labour hold

After becoming the first directly-elected Mayor of London on 4 May 2000 on an independent ticket, it took Ken Livingstone just two months to decide to announce that he was standing down as Labour MP for Brent East after 13 years, clearly disillusioned with the lack of influence that a (very controversial) backbencher could wield therein. His successor is likely to cause the party less grief in every way, but may not replicate the colourful nature and career of "Red Ken", whose rather unhappy sojourn in Parliament now seems more and more like a temporary blind alley between two periods of what he has enjoyed most and found most fulfilling: running the nation's capital and his home city.

With the departure of London's Mayor to star in if not 'Dick Whittington and his Cat', at least in 'Ken Livingstone and his Newt', Labour, are fielding Brent Council Leader, Paul Daisley. Born 1957 and educated at Littlemore School, Oxfordshire and Abingdon College, he joined Labour in 1982, was elected to Brent Council in 1990, became Leader of the Council in 1996 and describes himself as being "responsible for transforming Brent into a model Labour authority". It previously could not have been much worse.

 |
| Wealthy Achievers, Suburban Areas |
0.34% |
14.99% |
2.23 |
|
| Affluent Greys, Rural Communities |
0.00% |
2.13% |
0.00 |
|
| Prosperous Pensioners, Retirement Areas |
0.82% |
2.49% |
32.93 |
|
| Affluent Executives, Family Areas |
0.00% |
4.43% |
0.00 |
|
| Well-Off Workers, Family Areas |
0.00% |
7.27% |
0.00 |
|
| Affluent Urbanites, Town & City Areas |
12.12% |
2.56% |
472.50 |
|
| Prosperous Professionals, Metropolitan Areas |
10.67% |
2.04% |
522.83 |
|
| Better-Off Executives, Inner City Areas |
27.85% |
3.94% |
706.07 |
|
| Comfortable Middle Agers, Mature Home Owning Areas |
0.00% |
13.04% |
0.00 |
|
| Skilled Workers, Home Owning Areas |
0.00% |
12.70% |
0.00 |
|
| New Home Owners, Mature Communities |
0.00% |
8.14% |
0.00 |
|
| White Collar Workers, Better-Off Multi Ethnic Areas |
29.35% |
4.02% |
729.72 |
|
| Older People, Less Prosperous Areas |
0.00% |
3.19% |
0.00 |
|
| Council Estate Residents, Better-Off Homes |
0.74% |
11.31% |
6.52 |
|
| Council Estate Residents, High Unemployment |
7.24% |
3.06% |
236.37 |
|
| Council Estate Residents, Greatest Hardship |
0.00% |
2.52% |
0.00 |
|
| People in Multi-Ethnic, Low-Income Areas |
10.89% |
2.10% |
518.59 |
|
| Unclassified |
0.00% |
0.06% |
0.00 |
|
|
 |
 |
 |
| £0-5K |
5.19% |
9.41% |
55.08 |
|
| £5-10K |
11.58% |
16.63% |
69.60 |
|
| £10-15K |
13.83% |
16.58% |
83.44 |
|
| £15-20K |
13.04% |
13.58% |
95.98 |
|
| £20-25K |
11.11% |
10.39% |
106.93 |
|
| £25-30K |
9.05% |
7.77% |
116.39 |
|
| £30-35K |
7.21% |
5.79% |
124.51 |
|
| £35-40K |
5.70% |
4.33% |
131.50 |
|
| £40-45K |
4.49% |
3.27% |
137.54 |
|
| £45-50K |
3.54% |
2.48% |
142.78 |
|
| £50-55K |
2.81% |
1.90% |
147.37 |
|
| £55-60K |
2.23% |
1.47% |
151.40 |
|
| £60-65K |
1.78% |
1.15% |
154.97 |
|
| £65-70K |
1.43% |
0.91% |
158.15 |
|
| £70-75K |
1.16% |
0.72% |
160.99 |
|
| £75-80K |
0.94% |
0.57% |
163.55 |
|
| £80-85K |
0.77% |
0.46% |
165.87 |
|
| £85-90K |
0.63% |
0.37% |
167.97 |
|
| £90-95K |
0.52% |
0.31% |
169.88 |
|
| £95-100K |
0.43% |
0.25% |
171.63 |
|
| £100K + |
2.41% |
1.34% |
179.13 |
|
|
|

|


|
1992-1997
|
1997-2001
|
|
|
|
| Con |
-14.30% |
| Lab |
14.53% |
| LD |
-1.10% |
|
| Con |
-4.10% |
| Lab |
-4.12% |
| LD |
2.77% |
|
|
 |
Paul Daisley
Labour hold
|
| Con |
 |
5,278 |
18.21% |
| Lab |
 |
18,325 |
63.21% |
| LD |
 |
3,065 |
10.57% |
| Oth |
 |
2,324 |
8.02% |
| Maj |
 |
13,047 |
45.00% |
| Turn |
 |
28,992 |
49.90% |
|
|
 |
Paul Daisley
Labour hold
|
| G |
Simone Aspis |
1,361 |
4.69% |
| LD |
Nowsheen Bhatti |
3,065 |
10.57% |
| SL |
Iris Cremer |
383 |
1.32% |
| L |
Paul Daisley |
18,325 |
63.21% |
| C |
David Gauke |
5,278 |
18.21% |
| P |
Sarah Macken |
392 |
1.35% |
| UK |
Ashwin Tanna |
188 |
0.65% |
|
Candidates representing 7 parties stood for election to this seat.
|
|
 |
Ken Livingstone
Labour
|
| Con |
 |
7,866 |
22.30% |
| Lab |
 |
23,748 |
67.33% |
| LD |
 |
2,751 |
7.80% |
| Ref |
|
0 |
0.00% |
| Oth |
 |
907 |
2.57% |
| Maj |
 |
15,882 |
45.03% |
| Turn |
 |
35,272 |
65.87% |
|
|
 |
|
Labour
|
| Con |
 |
13,365 |
36.60% |
| Lab |
 |
19,314 |
52.80% |
| LD |
 |
3,237 |
8.90% |
| Oth |
 |
642 |
1.80% |
| Maj |
 |
5,949 |
16.30% |
| Turn |
 |
36,558 |
64.35% |
|
|
 |
|

|

