|
Brent North
Labour hold

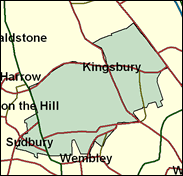
One of Labour's many surprise gains in outer North London in 1997, Brent North superficially looks a prime candidate for a Tory recapture next time, with 40pc of its heads of household in professional and managerial occupations, 70pc middle class, and over 75pc of houses owner occupied. However, it might not be so easy as all that. The Conservatives did poll 10pc more votes than Labour in the wards which make up the seat in the borough elections of May 1998, but Labour still gained Fryent, Queensbury and Roe Green; and in June 1999 even on a low turnout and an unfavourable issue, Labour pipped the Tories within the seat in the European election voting. The large Asian vote in this seat has been seen as one reason for a trend to Labour, especially since the Muslim community has grown in recent years while the generally more affluent Gujaratis have tended to move away, but this should be seen in the context of a possible split in the Muslim vote due partly to the defending member Barry Gardiner's membership of Labour Friends of Israel. It is all very complex in a varied and fascinating marginal.

Barry Gardiner, MP here since 1997, is one of Labour's most ponderous orators, to whom a bored parliamentary colleague mockingly sought to set fire during one of his laboriously-delivered Commons speeches. Somewhat over-educated at Glasgow High School, Haileybury, St Andrews University, Harvard, and Corpus Christi College Cambridge, he was Scots-born in 1957, is a shipping arbitrator by trade, and in 1997 contributed to the PLP's pool of 43 beards. A contributor to The Philosophical Quarterly, he has more prosaically campaigned for local leaseholders against landlords, and backed attempts to license dangerous mini cab drivers.

 |
| Wealthy Achievers, Suburban Areas |
14.61% |
14.99% |
97.41 |
|
| Affluent Greys, Rural Communities |
0.00% |
2.13% |
0.00 |
|
| Prosperous Pensioners, Retirement Areas |
1.09% |
2.49% |
43.66 |
|
| Affluent Executives, Family Areas |
0.00% |
4.43% |
0.00 |
|
| Well-Off Workers, Family Areas |
0.00% |
7.27% |
0.00 |
|
| Affluent Urbanites, Town & City Areas |
4.71% |
2.56% |
183.67 |
|
| Prosperous Professionals, Metropolitan Areas |
5.50% |
2.04% |
269.53 |
|
| Better-Off Executives, Inner City Areas |
1.54% |
3.94% |
38.97 |
|
| Comfortable Middle Agers, Mature Home Owning Areas |
4.50% |
13.04% |
34.50 |
|
| Skilled Workers, Home Owning Areas |
0.30% |
12.70% |
2.34 |
|
| New Home Owners, Mature Communities |
0.55% |
8.14% |
6.74 |
|
| White Collar Workers, Better-Off Multi Ethnic Areas |
61.35% |
4.02% |
1,525.62 |
|
| Older People, Less Prosperous Areas |
1.25% |
3.19% |
39.15 |
|
| Council Estate Residents, Better-Off Homes |
0.22% |
11.31% |
1.97 |
|
| Council Estate Residents, High Unemployment |
2.99% |
3.06% |
97.54 |
|
| Council Estate Residents, Greatest Hardship |
0.00% |
2.52% |
0.00 |
|
| People in Multi-Ethnic, Low-Income Areas |
1.40% |
2.10% |
66.85 |
|
| Unclassified |
0.00% |
0.06% |
0.00 |
|
|
 |
 |
 |
| £0-5K |
4.36% |
9.41% |
46.37 |
|
| £5-10K |
9.75% |
16.63% |
58.62 |
|
| £10-15K |
12.17% |
16.58% |
73.42 |
|
| £15-20K |
12.06% |
13.58% |
88.78 |
|
| £20-25K |
10.78% |
10.39% |
103.71 |
|
| £25-30K |
9.16% |
7.77% |
117.76 |
|
| £30-35K |
7.57% |
5.79% |
130.74 |
|
| £35-40K |
6.18% |
4.33% |
142.59 |
|
| £40-45K |
5.01% |
3.27% |
153.32 |
|
| £45-50K |
4.05% |
2.48% |
162.99 |
|
| £50-55K |
3.27% |
1.90% |
171.68 |
|
| £55-60K |
2.65% |
1.47% |
179.48 |
|
| £60-65K |
2.15% |
1.15% |
186.45 |
|
| £65-70K |
1.75% |
0.91% |
192.68 |
|
| £70-75K |
1.43% |
0.72% |
198.25 |
|
| £75-80K |
1.17% |
0.57% |
203.23 |
|
| £80-85K |
0.96% |
0.46% |
207.66 |
|
| £85-90K |
0.79% |
0.37% |
211.61 |
|
| £90-95K |
0.66% |
0.31% |
215.13 |
|
| £95-100K |
0.55% |
0.25% |
218.25 |
|
| £100K + |
3.07% |
1.34% |
228.76 |
|
|
|

|


|
1992-1997
|
1997-2001
|
|
|
|
| Con |
-17.26% |
| Lab |
20.37% |
| LD |
-2.47% |
|
| Con |
-10.84% |
| Lab |
8.70% |
| LD |
3.20% |
|
|
 |
Barry Gardiner
Labour hold
|
| Con |
 |
9,944 |
29.30% |
| Lab |
 |
20,149 |
59.37% |
| LD |
 |
3,846 |
11.33% |
| Oth |
|
0 |
0.00% |
| Maj |
 |
10,205 |
30.07% |
| Turn |
 |
33,939 |
57.73% |
|
|
 |
Barry Gardiner
Labour hold
|
| C |
Philip Allott |
9,944 |
29.30% |
| L |
Barry Gardiner |
20,149 |
59.37% |
| LD |
Paul Lorber |
3,846 |
11.33% |
|
Candidates representing 3 parties stood for election to this seat.
|
|
 |
Barry Gardiner
Labour gain
|
| Con |
 |
15,324 |
40.14% |
| Lab |
 |
19,343 |
50.67% |
| LD |
 |
3,104 |
8.13% |
| Ref |
|
0 |
0.00% |
| Oth |
 |
403 |
1.06% |
| Maj |
 |
4,019 |
10.53% |
| Turn |
 |
38,174 |
70.50% |
|
|
 |
|
Conservative
|
| Con |
 |
21,660 |
57.40% |
| Lab |
 |
11,430 |
30.30% |
| LD |
 |
3,999 |
10.60% |
| Oth |
 |
624 |
1.70% |
| Maj |
 |
10,230 |
27.10% |
| Turn |
 |
37,713 |
68.03% |
|
|
 |
|

|

