|
Altrincham & Sale West
Conservative hold

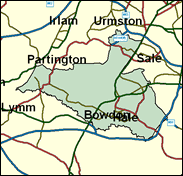
This is one of the seats that was expected to be solidly Conservative, a part of the Cheshire commuter belt in the south west of the Greater Manchester metropolitan area, more than 70pc middle class, and nearly 80pc owner occupied, 97pc white, and proud of its metaphorical distance from inner city Manchester. Yet Graham Brady was pressed to a 1,500 margin by Labour last time, which technically makes Altrincham and Sale West the fifteenth most vulnerable seat to a further Labour advance. The Tories have outpolled Labour easily in Trafford borough contests in the wards within this seat since their scare in 1997 though, and achieved nearly double the Labour vote in the European elections of 1999, and more than twice as many in the Trafford Borough elections of 2000. However, this evidence of an increased majority next time is based on much lower turnouts than can be expected in a general election.

Conservative education spokesman Graham Brady was the youngest Tory MP (born 1967) elected in 1997, and one of only two Conservatives elected in either the Manchester or Liverpool conurbations A PR man, he was educated locally at Altrincham Grammar School, and at Durham University, and specialises in defending grammar schools. Otherwise he is hostile to the Euro, voted for Michael Howard for leader, and for homosexual sex at 16, and bears some resemblance, with a big mouth full of teeth, to Prince Andrew. Labour's hopes rest with Jane Baugh, born 1947 and educated at Whitchurch Grammar School Cardiff and at Cardiff School of Physiotherapy. She fought the seat in 1997.

 |
| Wealthy Achievers, Suburban Areas |
36.85% |
14.99% |
245.79 |
|
| Affluent Greys, Rural Communities |
0.00% |
2.13% |
0.00 |
|
| Prosperous Pensioners, Retirement Areas |
1.18% |
2.49% |
47.45 |
|
| Affluent Executives, Family Areas |
3.34% |
4.43% |
75.48 |
|
| Well-Off Workers, Family Areas |
9.37% |
7.27% |
128.87 |
|
| Affluent Urbanites, Town & City Areas |
6.83% |
2.56% |
266.21 |
|
| Prosperous Professionals, Metropolitan Areas |
0.88% |
2.04% |
43.02 |
|
| Better-Off Executives, Inner City Areas |
0.66% |
3.94% |
16.84 |
|
| Comfortable Middle Agers, Mature Home Owning Areas |
17.17% |
13.04% |
131.70 |
|
| Skilled Workers, Home Owning Areas |
5.40% |
12.70% |
42.54 |
|
| New Home Owners, Mature Communities |
5.34% |
8.14% |
65.57 |
|
| White Collar Workers, Better-Off Multi Ethnic Areas |
3.67% |
4.02% |
91.19 |
|
| Older People, Less Prosperous Areas |
1.10% |
3.19% |
34.41 |
|
| Council Estate Residents, Better-Off Homes |
6.61% |
11.31% |
58.44 |
|
| Council Estate Residents, High Unemployment |
0.60% |
3.06% |
19.47 |
|
| Council Estate Residents, Greatest Hardship |
1.00% |
2.52% |
39.73 |
|
| People in Multi-Ethnic, Low-Income Areas |
0.00% |
2.10% |
0.00 |
|
| Unclassified |
0.00% |
0.06% |
0.00 |
|
|
 |
 |
 |
| £0-5K |
5.59% |
9.41% |
59.39 |
|
| £5-10K |
11.62% |
16.63% |
69.85 |
|
| £10-15K |
13.47% |
16.58% |
81.26 |
|
| £15-20K |
12.57% |
13.58% |
92.53 |
|
| £20-25K |
10.73% |
10.39% |
103.22 |
|
| £25-30K |
8.80% |
7.77% |
113.15 |
|
| £30-35K |
7.09% |
5.79% |
122.32 |
|
| £35-40K |
5.66% |
4.33% |
130.75 |
|
| £40-45K |
4.52% |
3.27% |
138.49 |
|
| £45-50K |
3.61% |
2.48% |
145.59 |
|
| £50-55K |
2.90% |
1.90% |
152.11 |
|
| £55-60K |
2.33% |
1.47% |
158.11 |
|
| £60-65K |
1.88% |
1.15% |
163.64 |
|
| £65-70K |
1.53% |
0.91% |
168.75 |
|
| £70-75K |
1.25% |
0.72% |
173.48 |
|
| £75-80K |
1.02% |
0.57% |
177.85 |
|
| £80-85K |
0.84% |
0.46% |
181.92 |
|
| £85-90K |
0.70% |
0.37% |
185.71 |
|
| £90-95K |
0.58% |
0.31% |
189.24 |
|
| £95-100K |
0.48% |
0.25% |
192.53 |
|
| £100K + |
2.81% |
1.34% |
208.75 |
|
|
|

|


|
1992-1997
|
1997-2001
|
|
|
|
| Con |
-11.34% |
| Lab |
13.85% |
| LD |
-5.78% |
|
| Con |
3.01% |
| Lab |
-0.84% |
| LD |
1.80% |
|
|
 |
Graham Brady
Conservative hold
|
| Con |
 |
20,113 |
46.16% |
| Lab |
 |
17,172 |
39.41% |
| LD |
 |
6,283 |
14.42% |
| Oth |
|
0 |
0.00% |
| Maj |
 |
2,941 |
6.75% |
| Turn |
 |
43,568 |
60.66% |
|
|
 |
Graham Brady
Conservative hold
|
| L |
Janet Baugh |
17,172 |
39.41% |
| C |
Graham Brady |
20,113 |
46.16% |
| LD |
Christopher Gaskell |
6,283 |
14.42% |
|
Candidates representing 3 parties stood for election to this seat.
|
|
 |
Graham Brady
Conservative
|
| Con |
 |
22,348 |
43.16% |
| Lab |
 |
20,843 |
40.25% |
| LD |
 |
6,535 |
12.62% |
| Ref |
 |
1,348 |
2.60% |
| Oth |
 |
708 |
1.37% |
| Maj |
 |
1,505 |
2.91% |
| Turn |
 |
51,782 |
73.32% |
|
|
 |
|
Conservative
|
| Con |
 |
30,343 |
54.50% |
| Lab |
 |
14,727 |
26.40% |
| LD |
 |
10,261 |
18.40% |
| Oth |
 |
366 |
0.70% |
| Maj |
 |
15,616 |
28.00% |
| Turn |
 |
55,697 |
78.41% |
|
|
 |
|

|

