|
Brentford & Isleworth
Labour hold

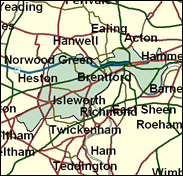
The eastern half of the long thin borough of Hounslow in west London consists of a number of disparate communities, all of which swung so heavily to Labour in 1997 that the seat scarcely looks like a marginal. Indeed no Labour gain of that year had a majority as great as this one, 14,424. Small wonder that its previous MP, Nirj Deva, has headed for the Strasbourg Parliament. It is possible that he was abandoned by every ward in the seat, heterogeneous as they are. The Conservatives were probably competitive in Turnham Green and Chiswick in the east, and Spring Grove, north Isleworth, but Labour would certainly have prevailed in Brentford, Isleworth South, and those parts of Hounslow itself within this division rather than Feltham and Heston. Mr and Mrs Keen represent Hounslow now, and are almost certain to carry on doing so after the Election.

For Labour's Ann Keen, elected here in 1997 after two previous attempts , the Commons is home-from-home, with her husband as MP for the next door seat of Feltham & Heston, and her sister Sylvia Heal as a Deputy Speaker. With her rediscovery in 1995 of her by then 28-year old homosexual son whom she had given up for adoption as a baby, she has become a leader of the campaign to lower the homosexual age of consent to 16. A steelworker's daughter and a former nurse, born 1948 and educated at Elfed Secondary Modern School, Flint, and eventually at Surrey University, she rose in Labour politics as a friend of Neil and Glenys Kinnock, and mirrored their the political journey away from the left.

 |
| Wealthy Achievers, Suburban Areas |
3.64% |
14.99% |
24.27 |
|
| Affluent Greys, Rural Communities |
0.00% |
2.13% |
0.00 |
|
| Prosperous Pensioners, Retirement Areas |
0.98% |
2.49% |
39.28 |
|
| Affluent Executives, Family Areas |
0.56% |
4.43% |
12.67 |
|
| Well-Off Workers, Family Areas |
0.14% |
7.27% |
1.87 |
|
| Affluent Urbanites, Town & City Areas |
12.15% |
2.56% |
473.67 |
|
| Prosperous Professionals, Metropolitan Areas |
18.64% |
2.04% |
913.40 |
|
| Better-Off Executives, Inner City Areas |
6.82% |
3.94% |
172.95 |
|
| Comfortable Middle Agers, Mature Home Owning Areas |
6.01% |
13.04% |
46.08 |
|
| Skilled Workers, Home Owning Areas |
2.21% |
12.70% |
17.40 |
|
| New Home Owners, Mature Communities |
2.07% |
8.14% |
25.41 |
|
| White Collar Workers, Better-Off Multi Ethnic Areas |
27.98% |
4.02% |
695.73 |
|
| Older People, Less Prosperous Areas |
0.48% |
3.19% |
15.09 |
|
| Council Estate Residents, Better-Off Homes |
4.17% |
11.31% |
36.91 |
|
| Council Estate Residents, High Unemployment |
7.68% |
3.06% |
250.78 |
|
| Council Estate Residents, Greatest Hardship |
1.58% |
2.52% |
62.86 |
|
| People in Multi-Ethnic, Low-Income Areas |
4.89% |
2.10% |
232.90 |
|
| Unclassified |
0.00% |
0.06% |
0.00 |
|
|
 |
 |
 |
| £0-5K |
5.54% |
9.41% |
58.86 |
|
| £5-10K |
10.74% |
16.63% |
64.59 |
|
| £10-15K |
12.50% |
16.58% |
75.39 |
|
| £15-20K |
11.89% |
13.58% |
87.55 |
|
| £20-25K |
10.38% |
10.39% |
99.88 |
|
| £25-30K |
8.70% |
7.77% |
111.89 |
|
| £30-35K |
7.14% |
5.79% |
123.35 |
|
| £35-40K |
5.81% |
4.33% |
134.16 |
|
| £40-45K |
4.71% |
3.27% |
144.33 |
|
| £45-50K |
3.82% |
2.48% |
153.86 |
|
| £50-55K |
3.10% |
1.90% |
162.81 |
|
| £55-60K |
2.52% |
1.47% |
171.21 |
|
| £60-65K |
2.06% |
1.15% |
179.11 |
|
| £65-70K |
1.69% |
0.91% |
186.57 |
|
| £70-75K |
1.39% |
0.72% |
193.62 |
|
| £75-80K |
1.15% |
0.57% |
200.31 |
|
| £80-85K |
0.96% |
0.46% |
206.67 |
|
| £85-90K |
0.80% |
0.37% |
212.73 |
|
| £90-95K |
0.67% |
0.31% |
218.52 |
|
| £95-100K |
0.56% |
0.25% |
224.07 |
|
| £100K + |
3.45% |
1.34% |
256.66 |
|
|
|

|


|
1992-1997
|
1997-2001
|
|
|
|
| Con |
-13.85% |
| Lab |
14.65% |
| LD |
-1.88% |
|
| Con |
-1.98% |
| Lab |
-3.96% |
| LD |
5.56% |
|
|
 |
Ann Keen
Labour hold
|
| Con |
 |
12,957 |
29.78% |
| Lab |
 |
23,275 |
53.49% |
| LD |
 |
5,994 |
13.77% |
| Oth |
 |
1,288 |
2.96% |
| Maj |
 |
10,318 |
23.71% |
| Turn |
 |
43,514 |
51.77% |
|
|
 |
Ann Keen
Labour hold
|
| SA |
Danny Faith |
408 |
0.94% |
| G |
Nic Ferriday |
324 |
0.74% |
| LD |
Gareth Hartwell |
5,994 |
13.77% |
| UK |
Gerald Ingram |
412 |
0.95% |
| L |
Ann Keen |
23,275 |
53.49% |
| I |
Asa Khaira |
144 |
0.33% |
| C |
Tim Mack |
12,957 |
29.78% |
|
Candidates representing 7 parties stood for election to this seat.
|
|
 |
Ann Keen
Labour gain
|
| Con |
 |
17,825 |
31.75% |
| Lab |
 |
32,249 |
57.45% |
| LD |
 |
4,613 |
8.22% |
| Ref |
|
0 |
0.00% |
| Oth |
 |
1,448 |
2.58% |
| Maj |
 |
14,424 |
25.70% |
| Turn |
 |
56,135 |
71.00% |
|
|
 |
|
Conservative
|
| Con |
 |
26,994 |
45.60% |
| Lab |
 |
25,319 |
42.80% |
| LD |
 |
5,962 |
10.10% |
| Oth |
 |
904 |
1.50% |
| Maj |
 |
1,675 |
2.80% |
| Turn |
 |
59,179 |
74.19% |
|
|
 |
|

|

