|
Bridgend
Labour hold

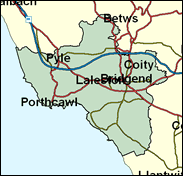
One south Wales seat where the Conservatives have won in living memory (1983-87) is Bridgend. This is not a true valley seat, but more similar to the Vale of Glamorgan to the east, even though it was technically in mid-Glamorgan before that odd creation was abolished in the 1990s. Bridgend was never a mining town, and the seat also includes farmland and seaside, such as that at the resort of Porthcawl, the home base of that one Tory MP (Peter Hubbard-Miles). This is English-speaking, middle class, owner occupied country, and if it were not in Wales it would have been won by the Tories more than that one time. As things stand it is safe for Win Griffiths.

Wyn Griffiths, a quiet wiry Welsh chalk-face worker, taught for eleven years before becoming an MEP for ten years until his election here in 1987. A Methodist lay preacher with attendant reservations on smoking, euthanasia and homosexuality, he was born 1943, educated at Brecon Boys Grammar School and Cardiff University, and served for twelve months as a junior Welsh Office Minister before being sacked in 1998.

 |
| Wealthy Achievers, Suburban Areas |
23.26% |
14.99% |
155.14 |
|
| Affluent Greys, Rural Communities |
0.00% |
2.13% |
0.00 |
|
| Prosperous Pensioners, Retirement Areas |
4.70% |
2.49% |
189.20 |
|
| Affluent Executives, Family Areas |
6.24% |
4.43% |
140.92 |
|
| Well-Off Workers, Family Areas |
8.93% |
7.27% |
122.71 |
|
| Affluent Urbanites, Town & City Areas |
0.14% |
2.56% |
5.28 |
|
| Prosperous Professionals, Metropolitan Areas |
0.01% |
2.04% |
0.37 |
|
| Better-Off Executives, Inner City Areas |
0.94% |
3.94% |
23.92 |
|
| Comfortable Middle Agers, Mature Home Owning Areas |
13.78% |
13.04% |
105.70 |
|
| Skilled Workers, Home Owning Areas |
12.05% |
12.70% |
94.84 |
|
| New Home Owners, Mature Communities |
14.65% |
8.14% |
179.87 |
|
| White Collar Workers, Better-Off Multi Ethnic Areas |
3.54% |
4.02% |
88.00 |
|
| Older People, Less Prosperous Areas |
3.94% |
3.19% |
123.82 |
|
| Council Estate Residents, Better-Off Homes |
6.30% |
11.31% |
55.73 |
|
| Council Estate Residents, High Unemployment |
0.89% |
3.06% |
29.19 |
|
| Council Estate Residents, Greatest Hardship |
0.63% |
2.52% |
25.04 |
|
| People in Multi-Ethnic, Low-Income Areas |
0.00% |
2.10% |
0.00 |
|
| Unclassified |
0.00% |
0.06% |
0.00 |
|
|
 |
 |
 |
| £0-5K |
8.90% |
9.41% |
94.59 |
|
| £5-10K |
16.97% |
16.63% |
102.02 |
|
| £10-15K |
17.41% |
16.58% |
104.98 |
|
| £15-20K |
14.29% |
13.58% |
105.17 |
|
| £20-25K |
10.78% |
10.39% |
103.70 |
|
| £25-30K |
7.88% |
7.77% |
101.34 |
|
| £30-35K |
5.71% |
5.79% |
98.57 |
|
| £35-40K |
4.15% |
4.33% |
95.68 |
|
| £40-45K |
3.03% |
3.27% |
92.84 |
|
| £45-50K |
2.24% |
2.48% |
90.12 |
|
| £50-55K |
1.67% |
1.90% |
87.56 |
|
| £55-60K |
1.26% |
1.47% |
85.17 |
|
| £60-65K |
0.95% |
1.15% |
82.94 |
|
| £65-70K |
0.73% |
0.91% |
80.87 |
|
| £70-75K |
0.57% |
0.72% |
78.94 |
|
| £75-80K |
0.44% |
0.57% |
77.14 |
|
| £80-85K |
0.35% |
0.46% |
75.45 |
|
| £85-90K |
0.28% |
0.37% |
73.86 |
|
| £90-95K |
0.22% |
0.31% |
72.36 |
|
| £95-100K |
0.18% |
0.25% |
70.95 |
|
| £100K + |
0.85% |
1.34% |
63.15 |
|
|
|

|


|
1992-1997
|
1997-2001
|
|
|
|
| Con |
-12.89% |
| Lab |
6.75% |
| LD |
1.18% |
| PC |
1.01% |
|
| Con |
2.53% |
| Lab |
-5.57% |
| LD |
2.92% |
| PC |
3.36% |
|
|
 |
Win Griffiths
Labour hold
|
| Con |
 |
9,377 |
25.34% |
| Lab |
 |
19,422 |
52.49% |
| LD |
 |
5,330 |
14.40% |
| PC |
 |
2,652 |
7.17% |
| Oth |
 |
223 |
0.60% |
| Maj |
 |
10,045 |
27.15% |
| Turn |
 |
37,004 |
60.17% |
|
|
 |
Win Griffiths
Labour hold
|
| LD |
Jean Barraclough |
5,330 |
14.40% |
| C |
Tania Brisby |
9,377 |
25.34% |
| L |
Win Griffiths |
19,422 |
52.49% |
| P |
Sara Jeremy |
223 |
0.60% |
| PC |
Monica Mahoney |
2,652 |
7.17% |
|
Candidates representing 5 parties stood for election to this seat.
|
|
 |
Win Griffiths
Labour
|
| Con |
 |
9,867 |
22.81% |
| Lab |
 |
25,115 |
58.05% |
| LD |
 |
4,968 |
11.48% |
| PC |
 |
1,649 |
3.81% |
| Ref |
 |
1,662 |
3.84% |
| Oth |
|
0 |
0.00% |
| Maj |
 |
15,248 |
35.25% |
| Turn |
 |
43,261 |
72.44% |
|
|
 |
|
Labour
|
| Con |
 |
16,817 |
35.70% |
| Lab |
 |
24,143 |
51.30% |
| LD |
 |
4,827 |
10.30% |
| PC |
 |
1,301 |
2.80% |
| Oth |
|
0 |
0.00% |
| Maj |
 |
7,326 |
15.60% |
| Turn |
 |
47,088 |
79.23% |
|
|
 |
|

|

