|
Bridgwater
Conservative hold

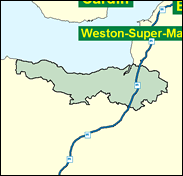
The veteran and senior Conservative Tom King has announced his retirement from the Commons after 30 years' service, and the task of holding off the Liberal Democrat challenge here in north west Somerset falls to Ian Liddell-Grainger, who must hope he does better than he did in west Devon in 1997. Although the next parliamentary boundary changes will not come into effect at the forthcoming election, the Commission has already provisionally recommended that the whole of the hunting fastness of Exmoor should in future be included in the Bridgwater division, which would benefit the Conservatives.

Tom King's exit after 31 years as Tory MP here, opens the way for itinerant Scots-born farmer and businessman, Ian Liddell-Grainger. Born 1959 and educated at Millfield School and South of Scotland Agriculture College, Edinburgh, he farmed in the Borders and then ran office furniture and property management companies. After losing the North East Euro seat in 1994 he headed south and lost Torridge and West Devon to the Liberal Democrats in 1997. Chairman of the Devon branch of the Countryside Alliance, he will have to hope Lib Dem candidate Ian Thorn does not put together a Lib-Lab tactical vote to thwart him in his third attempt.

 |
| Wealthy Achievers, Suburban Areas |
16.01% |
14.99% |
106.76 |
|
| Affluent Greys, Rural Communities |
5.36% |
2.13% |
252.21 |
|
| Prosperous Pensioners, Retirement Areas |
5.55% |
2.49% |
223.12 |
|
| Affluent Executives, Family Areas |
3.82% |
4.43% |
86.24 |
|
| Well-Off Workers, Family Areas |
3.39% |
7.27% |
46.59 |
|
| Affluent Urbanites, Town & City Areas |
0.05% |
2.56% |
1.77 |
|
| Prosperous Professionals, Metropolitan Areas |
0.00% |
2.04% |
0.00 |
|
| Better-Off Executives, Inner City Areas |
0.67% |
3.94% |
17.05 |
|
| Comfortable Middle Agers, Mature Home Owning Areas |
19.32% |
13.04% |
148.15 |
|
| Skilled Workers, Home Owning Areas |
14.76% |
12.70% |
116.20 |
|
| New Home Owners, Mature Communities |
14.61% |
8.14% |
179.38 |
|
| White Collar Workers, Better-Off Multi Ethnic Areas |
2.40% |
4.02% |
59.76 |
|
| Older People, Less Prosperous Areas |
2.21% |
3.19% |
69.51 |
|
| Council Estate Residents, Better-Off Homes |
8.93% |
11.31% |
78.94 |
|
| Council Estate Residents, High Unemployment |
0.77% |
3.06% |
25.09 |
|
| Council Estate Residents, Greatest Hardship |
2.16% |
2.52% |
85.78 |
|
| People in Multi-Ethnic, Low-Income Areas |
0.00% |
2.10% |
0.00 |
|
| Unclassified |
0.00% |
0.06% |
0.00 |
|
|
 |
 |
 |
| £0-5K |
10.46% |
9.41% |
111.09 |
|
| £5-10K |
19.57% |
16.63% |
117.66 |
|
| £10-15K |
19.08% |
16.58% |
115.07 |
|
| £15-20K |
14.78% |
13.58% |
108.78 |
|
| £20-25K |
10.54% |
10.39% |
101.40 |
|
| £25-30K |
7.32% |
7.77% |
94.13 |
|
| £30-35K |
5.07% |
5.79% |
87.46 |
|
| £35-40K |
3.53% |
4.33% |
81.52 |
|
| £40-45K |
2.49% |
3.27% |
76.29 |
|
| £45-50K |
1.78% |
2.48% |
71.70 |
|
| £50-55K |
1.29% |
1.90% |
67.66 |
|
| £55-60K |
0.94% |
1.47% |
64.10 |
|
| £60-65K |
0.70% |
1.15% |
60.93 |
|
| £65-70K |
0.53% |
0.91% |
58.11 |
|
| £70-75K |
0.40% |
0.72% |
55.59 |
|
| £75-80K |
0.31% |
0.57% |
53.31 |
|
| £80-85K |
0.24% |
0.46% |
51.25 |
|
| £85-90K |
0.18% |
0.37% |
49.39 |
|
| £90-95K |
0.15% |
0.31% |
47.68 |
|
| £95-100K |
0.12% |
0.25% |
46.12 |
|
| £100K + |
0.52% |
1.34% |
38.88 |
|
|
|

|


|
1992-1997
|
1997-2001
|
|
|
|
| Con |
-9.87% |
| Lab |
3.05% |
| LD |
3.95% |
|
| Con |
3.51% |
| Lab |
2.01% |
| LD |
-3.62% |
|
|
 |
Ian Liddell-Grainger
Conservative hold
|
| Con |
 |
19,354 |
40.45% |
| Lab |
 |
12,806 |
26.76% |
| LD |
 |
14,367 |
30.03% |
| Oth |
 |
1,323 |
2.76% |
| Maj |
 |
4,987 |
10.42% |
| Turn |
 |
47,850 |
64.59% |
|
|
 |
Ian Liddell-Grainger
Conservative hold
|
| UK |
Vicky Gardner |
1,323 |
2.76% |
| C |
Ian Liddell-Grainger |
19,354 |
40.45% |
| L |
William Monteith |
12,806 |
26.76% |
| LD |
Ian Thorn |
14,367 |
30.03% |
|
Candidates representing 4 parties stood for election to this seat.
|
|
 |
Tom King
Conservative
|
| Con |
 |
20,174 |
36.93% |
| Lab |
 |
13,519 |
24.75% |
| LD |
 |
18,378 |
33.65% |
| Ref |
 |
2,551 |
4.67% |
| Oth |
|
0 |
0.00% |
| Maj |
 |
1,796 |
3.29% |
| Turn |
 |
54,622 |
74.79% |
|
|
 |
|
Conservative
|
| Con |
 |
26,610 |
46.80% |
| Lab |
 |
12,365 |
21.70% |
| LD |
 |
16,894 |
29.70% |
| Oth |
 |
1,041 |
1.80% |
| Maj |
 |
9,716 |
17.10% |
| Turn |
 |
56,910 |
80.03% |
|
|
 |
|

|

