|
Brigg & Goole
Labour hold

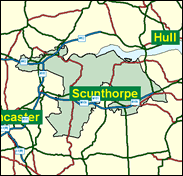
Whichever party wins this divided seat (essentially rural against urban) will probably win the next General Election. Brigg is a rather Conservative small market town, the HQ of the now abolished Glanford Council, which was so proud of its Lincolnshire roots that it hired a national expert to try to extract it from Humberside. In contrast, Goole is a working class and industrial inland port on the Ouse with a strong Yorkshire Labour tradition. The contest will be a re-run of the last one, between Ian Cawsey, now the sitting Labour MP, and the leading local Conservative politician, Donald Stewart. It is a two-way contest: the Liberal Democrats are exceptionally weak here. It should be exceptionally divisive, and informative. This is one of only three Labour seats in England where there were at the last Census over 2,000 people employed in agriculture, and these are of course all in the rural, and perhaps in 2001 Tory-swinging, parts of the seat. Much would then seem to depend on whether the Labour voters in the Goole urban area will turn out in such large numbers.

Labour's Ian Cawsey, cheery and burly, won the seat in 1997. Born 1960, educated at Wintringham School, an ex-local council leader, he worked for ten years as researcher for neighbouring MP Elliot Morley, whose interest in animal welfare he shares. Between them they have kept the fox-hunting issue on the boil so as to mobilise the voters in a second general election. His long-time Conservative opponent at local council and parliamentary election level, Donald Stewart, is standing again. Born 1941 he is a local farmer of Scots origin.

 |
| Wealthy Achievers, Suburban Areas |
20.08% |
14.99% |
133.95 |
|
| Affluent Greys, Rural Communities |
2.48% |
2.13% |
116.57 |
|
| Prosperous Pensioners, Retirement Areas |
0.35% |
2.49% |
14.14 |
|
| Affluent Executives, Family Areas |
1.87% |
4.43% |
42.18 |
|
| Well-Off Workers, Family Areas |
6.60% |
7.27% |
90.67 |
|
| Affluent Urbanites, Town & City Areas |
0.12% |
2.56% |
4.55 |
|
| Prosperous Professionals, Metropolitan Areas |
0.00% |
2.04% |
0.00 |
|
| Better-Off Executives, Inner City Areas |
0.04% |
3.94% |
0.93 |
|
| Comfortable Middle Agers, Mature Home Owning Areas |
25.64% |
13.04% |
196.60 |
|
| Skilled Workers, Home Owning Areas |
17.39% |
12.70% |
136.93 |
|
| New Home Owners, Mature Communities |
13.21% |
8.14% |
162.20 |
|
| White Collar Workers, Better-Off Multi Ethnic Areas |
0.81% |
4.02% |
20.08 |
|
| Older People, Less Prosperous Areas |
3.00% |
3.19% |
94.09 |
|
| Council Estate Residents, Better-Off Homes |
6.90% |
11.31% |
60.98 |
|
| Council Estate Residents, High Unemployment |
0.47% |
3.06% |
15.29 |
|
| Council Estate Residents, Greatest Hardship |
1.06% |
2.52% |
42.25 |
|
| People in Multi-Ethnic, Low-Income Areas |
0.00% |
2.10% |
0.00 |
|
| Unclassified |
0.00% |
0.06% |
0.00 |
|
|
 |
 |
 |
| £0-5K |
10.10% |
9.41% |
107.26 |
|
| £5-10K |
17.98% |
16.63% |
108.12 |
|
| £10-15K |
17.76% |
16.58% |
107.14 |
|
| £15-20K |
14.24% |
13.58% |
104.85 |
|
| £20-25K |
10.59% |
10.39% |
101.86 |
|
| £25-30K |
7.66% |
7.77% |
98.58 |
|
| £30-35K |
5.52% |
5.79% |
95.24 |
|
| £35-40K |
3.99% |
4.33% |
91.98 |
|
| £40-45K |
2.90% |
3.27% |
88.87 |
|
| £45-50K |
2.13% |
2.48% |
85.94 |
|
| £50-55K |
1.58% |
1.90% |
83.21 |
|
| £55-60K |
1.19% |
1.47% |
80.67 |
|
| £60-65K |
0.90% |
1.15% |
78.31 |
|
| £65-70K |
0.69% |
0.91% |
76.13 |
|
| £70-75K |
0.53% |
0.72% |
74.10 |
|
| £75-80K |
0.42% |
0.57% |
72.22 |
|
| £80-85K |
0.33% |
0.46% |
70.47 |
|
| £85-90K |
0.26% |
0.37% |
68.84 |
|
| £90-95K |
0.21% |
0.31% |
67.31 |
|
| £95-100K |
0.16% |
0.25% |
65.89 |
|
| £100K + |
0.79% |
1.34% |
58.60 |
|
|
|

|


|
1992-1997
|
1997-2001
|
|
|
|
| Con |
-13.25% |
| Lab |
14.50% |
| LD |
-4.47% |
|
| Con |
2.68% |
| Lab |
-1.32% |
| LD |
-0.78% |
|
|
 |
Ian Cawsey
Labour hold
|
| Con |
 |
16,105 |
39.23% |
| Lab |
 |
20,066 |
48.88% |
| LD |
 |
3,796 |
9.25% |
| Oth |
 |
1,087 |
2.65% |
| Maj |
 |
3,961 |
9.65% |
| Turn |
 |
41,054 |
64.62% |
|
|
 |
Ian Cawsey
Labour hold
|
| UK |
Godfrey Bloom |
688 |
1.68% |
| L |
Ian Cawsey |
20,066 |
48.88% |
| SL |
Michael Kenny |
399 |
0.97% |
| LD |
David Nolan |
3,796 |
9.25% |
| C |
Don Stewart |
16,105 |
39.23% |
|
Candidates representing 5 parties stood for election to this seat.
|
|
 |
Ian Cawsey
Labour gain
|
| Con |
 |
17,104 |
36.55% |
| Lab |
 |
23,493 |
50.20% |
| LD |
 |
4,692 |
10.03% |
| Ref |
 |
1,513 |
3.23% |
| Oth |
|
0 |
0.00% |
| Maj |
 |
6,389 |
13.65% |
| Turn |
 |
46,802 |
73.53% |
|
|
 |
|
Conservative
|
| Con |
 |
25,499 |
49.80% |
| Lab |
 |
18,258 |
35.70% |
| LD |
 |
7,406 |
14.50% |
| Oth |
|
0 |
0.00% |
| Maj |
 |
7,241 |
14.20% |
| Turn |
 |
51,163 |
81.19% |
|
|
 |
|

|

