|
Brighton, Kemptown
Labour hold

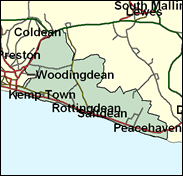
Although not the most favourable seat in the Brighton-Hove conurbation to a Conservative revival on past form, Kemptown would be lost by Labour on a four per cent swing. But Brighton seems to be undergoing a long-term move towards Labour, and Geoffrey Theobald's chances against Des Turner are no better than even. This is a very colourful seat and the contest will be full of oppositions and passions. Here is in many ways the centre of Brighton's vibrant gay community (Kemptown, or Kemp Town as it is often transcribed, has the predictable nickname of "Camp Town"); but there is also a much troubled peripheral council estates at Whitehill and Moulsecoomb; extremely respectable and expensive residential areas in Rottingdean near Roedean, one of the nation's elite girls' schools; bungaloid suburbia in Peacehaven and Saltdean; all the varied life of the seafront in Marine, King's Cliff and Queen's Park wards. Roll up, roll up; this could be just about the most fun of any constituency battle in the United Kingdom.

Desmond Turner who won the seat for Labour in 1997 has been a mix of sycophantic Blairite and later a moderate rebel over disability benefit cuts and - of local concern given the nearby flight path into Gatwick - air traffic control privatisation. Born 1939 and educated at Luton Grammar School and Imperial College London, a biochemist with a doctorate, he highlights the poverty of Brighton behind the Regency facades, which has accounted for Labour's electoral success. His Tory challenger, local estate agent Geoffrey Theobald, born 1944 and educated at Brighton, Hove and Sussex Grammar School and at a college of estate management, is son of a former Mayor of Brighton and has a high local press profile as Conservative opposition leader on Brighton Council, but cannot match Mr Turner's successful campaign against expanding the Portobello sewage works.

 |
| Wealthy Achievers, Suburban Areas |
9.34% |
14.99% |
62.32 |
|
| Affluent Greys, Rural Communities |
0.72% |
2.13% |
33.85 |
|
| Prosperous Pensioners, Retirement Areas |
14.73% |
2.49% |
592.37 |
|
| Affluent Executives, Family Areas |
1.19% |
4.43% |
26.85 |
|
| Well-Off Workers, Family Areas |
3.63% |
7.27% |
49.86 |
|
| Affluent Urbanites, Town & City Areas |
3.41% |
2.56% |
133.03 |
|
| Prosperous Professionals, Metropolitan Areas |
0.39% |
2.04% |
19.13 |
|
| Better-Off Executives, Inner City Areas |
9.52% |
3.94% |
241.31 |
|
| Comfortable Middle Agers, Mature Home Owning Areas |
12.93% |
13.04% |
99.19 |
|
| Skilled Workers, Home Owning Areas |
8.06% |
12.70% |
63.48 |
|
| New Home Owners, Mature Communities |
6.17% |
8.14% |
75.76 |
|
| White Collar Workers, Better-Off Multi Ethnic Areas |
8.52% |
4.02% |
211.81 |
|
| Older People, Less Prosperous Areas |
1.49% |
3.19% |
46.84 |
|
| Council Estate Residents, Better-Off Homes |
8.98% |
11.31% |
79.42 |
|
| Council Estate Residents, High Unemployment |
4.96% |
3.06% |
161.97 |
|
| Council Estate Residents, Greatest Hardship |
5.89% |
2.52% |
233.73 |
|
| People in Multi-Ethnic, Low-Income Areas |
0.00% |
2.10% |
0.00 |
|
| Unclassified |
0.07% |
0.06% |
109.10 |
|
|
 |
|
|
| £0-5K |
11.57% |
9.41% |
122.86 |
|
| £5-10K |
18.72% |
16.63% |
112.54 |
|
| £10-15K |
17.61% |
16.58% |
106.19 |
|
| £15-20K |
13.76% |
13.58% |
101.32 |
|
| £20-25K |
10.11% |
10.39% |
97.26 |
|
| £25-30K |
7.28% |
7.77% |
93.70 |
|
| £30-35K |
5.24% |
5.79% |
90.51 |
|
| £35-40K |
3.80% |
4.33% |
87.61 |
|
| £40-45K |
2.77% |
3.27% |
84.98 |
|
| £45-50K |
2.05% |
2.48% |
82.58 |
|
| £50-55K |
1.53% |
1.90% |
80.39 |
|
| £55-60K |
1.16% |
1.47% |
78.41 |
|
| £60-65K |
0.88% |
1.15% |
76.61 |
|
| £65-70K |
0.68% |
0.91% |
74.97 |
|
| £70-75K |
0.53% |
0.72% |
73.49 |
|
| £75-80K |
0.41% |
0.57% |
72.16 |
|
| £80-85K |
0.33% |
0.46% |
70.94 |
|
| £85-90K |
0.26% |
0.37% |
69.85 |
|
| £90-95K |
0.21% |
0.31% |
68.86 |
|
| £95-100K |
0.17% |
0.25% |
67.97 |
|
| £100K + |
0.87% |
1.34% |
64.55 |
|
|
|
|


|
1992-1997
|
1997-2001
|
|
|
|
| Con |
-13.90% |
| Lab |
13.96% |
| LD |
-4.19% |
|
| Con |
-3.64% |
| Lab |
1.26% |
| LD |
0.66% |
|
|
|
Desmond Turner
Labour hold
|
| Con |
 |
13,823 |
35.26% |
| Lab |
 |
18,745 |
47.82% |
| LD |
 |
4,064 |
10.37% |
| Oth |
 |
2,571 |
6.56% |
| Maj |
 |
4,922 |
12.56% |
| Turn |
|
39,203 |
57.97% |
|
|
|
Desmond Turner
Labour hold
|
| UK |
James Chamberlain-Webber |
543 |
1.39% |
| P |
Elaine Cook |
147 |
0.37% |
| FP |
Dave Dobbs |
227 |
0.58% |
| LD |
Jan Marshall |
4,064 |
10.37% |
| SL |
John McLeod |
364 |
0.93% |
| G |
Hugh Miller |
1,290 |
3.29% |
| C |
Geoffrey Theobald |
13,823 |
35.26% |
| L |
Desmond Turner |
18,745 |
47.82% |
|
Candidates representing 8 parties stood for election to this seat.
|
|
|
Desmond Turner
Labour gain
|
| Con |
|
17,945 |
38.90% |
| Lab |
|
21,479 |
46.56% |
| LD |
|
4,478 |
9.71% |
| Ref |
 |
1,526 |
3.31% |
| Oth |
|
704 |
1.53% |
| Maj |
|
3,534 |
7.66% |
| Turn |
|
46,132 |
70.81% |
|
|
|
|
Conservative
|
| Con |
|
26,828 |
52.80% |
| Lab |
|
16,571 |
32.60% |
| LD |
|
7,056 |
13.90% |
| Oth |
|
371 |
0.70% |
| Maj |
|
10,257 |
20.20% |
| Turn |
|
50,826 |
77.09% |
|
|
|
|
|