|
Brighton, Pavilion
Labour hold

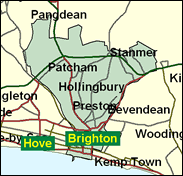
The west end and centre of Brighton is now the more strongly Labour of its two constituencies, which is not historically the case at all; indeed although Kemptown to the east has been won by Labour before (1964-70) Pavilion had never fallen when David Lepper seized it by no less than 13,000 votes in 1997. There have been some favourable boundary changes, but this is not the main reason for the long term swing. Brighton has changed. The gay vote has demonstrably both grown and become more open and even assertive here. A large transient population has arrived, ranging from bohemian types to social security claimants. There is a great number of students, both attending and more loosely connected with the two universities and many other establishments. This all generates a unique cosmopplitan atmosphere, more to the taste of some than others. There are some stable conventional family neighbourhoods like Preston and Patcham but these feel as if they are the ones out of kilter. Only in Brighton could one find a constituency called Pavilion, in which there is a ward called Regency. In fact, "only in Brighton" could be an apposite motto.

David Lepper, one of Labour's 1997 intake, bald and beaky and of Huguenot origin, born 1945, educated at secondary modern schools in Richmond and Wimbledon and at Kent and Sussex Universities, is a standard issue Labour MP: a schoolteacher and local councillor - eventually leader of Brighton council, and as a reflection of his town's downward mobility, campaigns against its poverty and homelessness.

 |
| Wealthy Achievers, Suburban Areas |
9.81% |
14.99% |
65.42 |
|
| Affluent Greys, Rural Communities |
0.00% |
2.13% |
0.00 |
|
| Prosperous Pensioners, Retirement Areas |
5.11% |
2.49% |
205.39 |
|
| Affluent Executives, Family Areas |
0.00% |
4.43% |
0.00 |
|
| Well-Off Workers, Family Areas |
0.03% |
7.27% |
0.37 |
|
| Affluent Urbanites, Town & City Areas |
4.32% |
2.56% |
168.44 |
|
| Prosperous Professionals, Metropolitan Areas |
10.77% |
2.04% |
527.76 |
|
| Better-Off Executives, Inner City Areas |
22.72% |
3.94% |
575.98 |
|
| Comfortable Middle Agers, Mature Home Owning Areas |
16.12% |
13.04% |
123.62 |
|
| Skilled Workers, Home Owning Areas |
7.11% |
12.70% |
55.98 |
|
| New Home Owners, Mature Communities |
3.45% |
8.14% |
42.35 |
|
| White Collar Workers, Better-Off Multi Ethnic Areas |
12.17% |
4.02% |
302.65 |
|
| Older People, Less Prosperous Areas |
1.72% |
3.19% |
53.96 |
|
| Council Estate Residents, Better-Off Homes |
2.79% |
11.31% |
24.70 |
|
| Council Estate Residents, High Unemployment |
3.76% |
3.06% |
122.77 |
|
| Council Estate Residents, Greatest Hardship |
0.09% |
2.52% |
3.48 |
|
| People in Multi-Ethnic, Low-Income Areas |
0.00% |
2.10% |
0.00 |
|
| Unclassified |
0.04% |
0.06% |
67.64 |
|
|
 |
 |
 |
| £0-5K |
9.85% |
9.41% |
104.63 |
|
| £5-10K |
15.62% |
16.63% |
93.93 |
|
| £10-15K |
15.39% |
16.58% |
92.82 |
|
| £15-20K |
12.86% |
13.58% |
94.70 |
|
| £20-25K |
10.14% |
10.39% |
97.53 |
|
| £25-30K |
7.82% |
7.77% |
100.53 |
|
| £30-35K |
5.99% |
5.79% |
103.40 |
|
| £35-40K |
4.59% |
4.33% |
106.03 |
|
| £40-45K |
3.54% |
3.27% |
108.40 |
|
| £45-50K |
2.74% |
2.48% |
110.51 |
|
| £50-55K |
2.14% |
1.90% |
112.39 |
|
| £55-60K |
1.68% |
1.47% |
114.08 |
|
| £60-65K |
1.33% |
1.15% |
115.59 |
|
| £65-70K |
1.06% |
0.91% |
116.96 |
|
| £70-75K |
0.85% |
0.72% |
118.21 |
|
| £75-80K |
0.69% |
0.57% |
119.36 |
|
| £80-85K |
0.56% |
0.46% |
120.41 |
|
| £85-90K |
0.45% |
0.37% |
121.40 |
|
| £90-95K |
0.37% |
0.31% |
122.32 |
|
| £95-100K |
0.31% |
0.25% |
123.19 |
|
| £100K + |
1.73% |
1.34% |
128.35 |
|
|
|

|


|
1992-1997
|
1997-2001
|
|
|
|
| Con |
-17.61% |
| Lab |
14.42% |
| LD |
-2.81% |
|
| Con |
-2.64% |
| Lab |
-5.89% |
| LD |
3.65% |
|
|
 |
David Lepper
Labour hold
|
| Con |
 |
10,203 |
25.05% |
| Lab |
 |
19,846 |
48.73% |
| LD |
 |
5,348 |
13.13% |
| Oth |
 |
5,326 |
13.08% |
| Maj |
 |
9,643 |
23.68% |
| Turn |
 |
40,723 |
58.85% |
|
|
 |
David Lepper
Labour hold
|
| LD |
Ruth Berry |
5,348 |
13.13% |
| FP |
Bob Dobbs |
409 |
1.00% |
| SL |
Ian Fyvie |
573 |
1.41% |
| C |
David Gold |
10,203 |
25.05% |
| UK |
Stuart Hutchin |
361 |
0.89% |
| LC |
David Lepper |
19,846 |
48.73% |
| P |
Marie Paragallo |
177 |
0.43% |
| G |
Keith Taylor |
3,806 |
9.35% |
|
Candidates representing 8 parties stood for election to this seat.
|
|
 |
David Lepper
Labour gain
|
| Con |
 |
13,556 |
27.69% |
| Lab |
 |
26,737 |
54.62% |
| LD |
 |
4,644 |
9.49% |
| Ref |
 |
1,304 |
2.66% |
| Oth |
 |
2,710 |
5.54% |
| Maj |
 |
13,181 |
26.93% |
| Turn |
 |
48,951 |
73.69% |
|
|
 |
|
Conservative
|
| Con |
 |
22,619 |
45.30% |
| Lab |
 |
20,089 |
40.20% |
| LD |
 |
6,169 |
12.30% |
| Oth |
 |
1,098 |
2.20% |
| Maj |
 |
2,530 |
5.10% |
| Turn |
 |
49,975 |
75.71% |
|
|
 |
|

|

