|
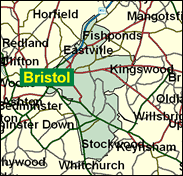
Bristol East
Labour hold

Now safely Labour, this is the seat which threw Tony Benn out of Parliament in 1983, to elect a Conservative. His previous seat, Bristol South East actually never threw him out at all, but rather kept re-electing him even when he was disqualified in the early 1960s. It is true that East only strayed during the heights of Margaret Thatcher's regime, urged on by Labour's drift to Left-wing policies - for which Benn must take some of the blame (he would still say credit).

Jean Corston, elected here in 1992, is PPS to David Blunkett, and a former Labour Party organiser - a background which serves to keep her out of the rebellions to which her left wing feminist inclinations - and marriage to the radical sociologist Peter Townsend - might otherwise tempt her. Born 1942, educated at Yeovil Girls' High School, Somerset College of Art & Technology and eventually graduating in law at LSE aged 47, before practising briefly as a barrister, her past is not Blairite (she voted for Beckett as leader in 1994) and ageism being what it is, can expect no further advancement as she approaches her sixtieth year.

 |
| Wealthy Achievers, Suburban Areas |
1.93% |
14.99% |
12.87 |
|
| Affluent Greys, Rural Communities |
0.00% |
2.13% |
0.00 |
|
| Prosperous Pensioners, Retirement Areas |
0.00% |
2.49% |
0.00 |
|
| Affluent Executives, Family Areas |
0.04% |
4.43% |
0.84 |
|
| Well-Off Workers, Family Areas |
5.18% |
7.27% |
71.27 |
|
| Affluent Urbanites, Town & City Areas |
1.05% |
2.56% |
40.79 |
|
| Prosperous Professionals, Metropolitan Areas |
0.00% |
2.04% |
0.00 |
|
| Better-Off Executives, Inner City Areas |
1.90% |
3.94% |
48.13 |
|
| Comfortable Middle Agers, Mature Home Owning Areas |
11.15% |
13.04% |
85.50 |
|
| Skilled Workers, Home Owning Areas |
38.17% |
12.70% |
300.52 |
|
| New Home Owners, Mature Communities |
9.52% |
8.14% |
116.92 |
|
| White Collar Workers, Better-Off Multi Ethnic Areas |
12.88% |
4.02% |
320.25 |
|
| Older People, Less Prosperous Areas |
5.24% |
3.19% |
164.44 |
|
| Council Estate Residents, Better-Off Homes |
5.98% |
11.31% |
52.83 |
|
| Council Estate Residents, High Unemployment |
6.36% |
3.06% |
207.78 |
|
| Council Estate Residents, Greatest Hardship |
0.27% |
2.52% |
10.78 |
|
| People in Multi-Ethnic, Low-Income Areas |
0.33% |
2.10% |
15.95 |
|
| Unclassified |
0.00% |
0.06% |
0.00 |
|
|
 |
 |
 |
| £0-5K |
11.32% |
9.41% |
120.25 |
|
| £5-10K |
20.47% |
16.63% |
123.08 |
|
| £10-15K |
19.39% |
16.58% |
116.96 |
|
| £15-20K |
14.78% |
13.58% |
108.84 |
|
| £20-25K |
10.42% |
10.39% |
100.25 |
|
| £25-30K |
7.14% |
7.77% |
91.80 |
|
| £30-35K |
4.86% |
5.79% |
83.84 |
|
| £35-40K |
3.31% |
4.33% |
76.50 |
|
| £40-45K |
2.28% |
3.27% |
69.85 |
|
| £45-50K |
1.59% |
2.48% |
63.88 |
|
| £50-55K |
1.12% |
1.90% |
58.55 |
|
| £55-60K |
0.79% |
1.47% |
53.80 |
|
| £60-65K |
0.57% |
1.15% |
49.58 |
|
| £65-70K |
0.42% |
0.91% |
45.82 |
|
| £70-75K |
0.31% |
0.72% |
42.47 |
|
| £75-80K |
0.23% |
0.57% |
39.48 |
|
| £80-85K |
0.17% |
0.46% |
36.80 |
|
| £85-90K |
0.13% |
0.37% |
34.40 |
|
| £90-95K |
0.10% |
0.31% |
32.24 |
|
| £95-100K |
0.08% |
0.25% |
30.29 |
|
| £100K + |
0.30% |
1.34% |
22.02 |
|
|
|

|


|
1992-1997
|
1997-2001
|
|
|
|
| Con |
-14.24% |
| Lab |
9.58% |
| LD |
0.07% |
|
| Con |
-1.01% |
| Lab |
-0.48% |
| LD |
2.81% |
|
|
 |
Jean Corston
Labour hold
|
| Con |
 |
8,788 |
22.35% |
| Lab |
 |
22,180 |
56.40% |
| LD |
 |
6,915 |
17.58% |
| Oth |
 |
1,441 |
3.66% |
| Maj |
 |
13,392 |
34.06% |
| Turn |
 |
39,324 |
55.95% |
|
|
 |
Jean Corston
Labour hold
|
| G |
Geoff Collard |
1,110 |
2.82% |
| L |
Jean Corston |
22,180 |
56.40% |
| C |
Jack Lo-Presti |
8,788 |
22.35% |
| LD |
Brian Niblett |
6,915 |
17.58% |
| SA |
Andy Pryor |
331 |
0.84% |
|
Candidates representing 5 parties stood for election to this seat.
|
|
 |
Jean Corston
Labour
|
| Con |
 |
11,259 |
23.36% |
| Lab |
 |
27,418 |
56.88% |
| LD |
 |
7,121 |
14.77% |
| Ref |
 |
1,479 |
3.07% |
| Oth |
 |
924 |
1.92% |
| Maj |
 |
16,159 |
33.52% |
| Turn |
 |
48,201 |
69.87% |
|
|
 |
|
Labour
|
| Con |
 |
20,472 |
37.60% |
| Lab |
 |
25,754 |
47.30% |
| LD |
 |
8,025 |
14.70% |
| Oth |
 |
251 |
0.50% |
| Maj |
 |
5,282 |
9.70% |
| Turn |
 |
54,502 |
78.50% |
|
|
 |
|

|

